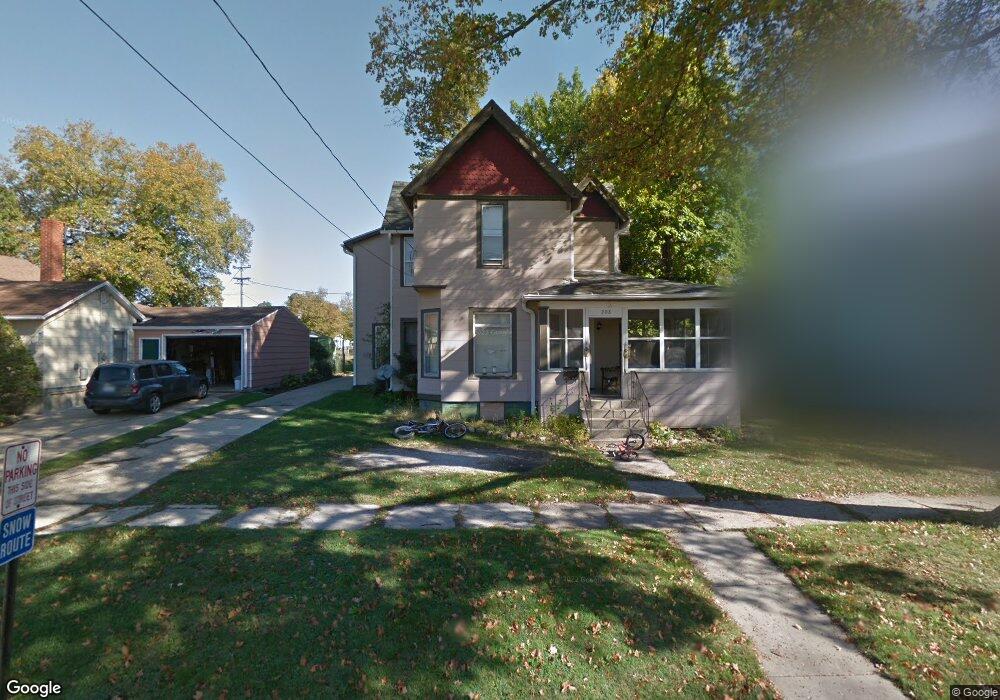
208 W Wall St Morrison, IL 61270
Estimated Value: $86,000 - $104,579
4
Beds
2
Baths
1,500
Sq Ft
$66/Sq Ft
Est. Value
About This Home
This home is located at 208 W Wall St, Morrison, IL 61270 and is currently estimated at $98,645, approximately $65 per square foot. 208 W Wall St is a home located in Whiteside County with nearby schools including Northside School, Southside School, and Morrison Junior High School.
Ownership History
Date
Name
Owned For
Owner Type
Purchase Details
Closed on
Dec 21, 2018
Sold by
Carolyn Jane Darby T
Bought by
Darby Bruce W
Current Estimated Value
Purchase Details
Closed on
Nov 16, 2018
Sold by
Darby Carolyn J
Bought by
Carolyn Jane Darby T
Purchase Details
Closed on
Apr 5, 2005
Sold by
Darby Larry H
Bought by
Darby Larry H and Darby Bruce Wayne
Purchase Details
Closed on
Mar 21, 2005
Sold by
Emc Mortgage Corp
Bought by
Darby Larry H
Purchase Details
Closed on
Jan 31, 2005
Sold by
Anderson Kent L and Anderson Marcel L
Bought by
Emc Mortgage Corporation
Create a Home Valuation Report for This Property
The Home Valuation Report is an in-depth analysis detailing your home's value as well as a comparison with similar homes in the area
Home Values in the Area
Average Home Value in this Area
Purchase History
| Date | Buyer | Sale Price | Title Company |
|---|---|---|---|
| Darby Bruce W | -- | -- | |
| Carolyn Jane Darby T | -- | -- | |
| Darby Larry H | -- | None Available | |
| Darby Larry H | $23,000 | None Available | |
| Emc Mortgage Corporation | -- | None Available |
Source: Public Records
Tax History
| Year | Tax Paid | Tax Assessment Tax Assessment Total Assessment is a certain percentage of the fair market value that is determined by local assessors to be the total taxable value of land and additions on the property. | Land | Improvement |
|---|---|---|---|---|
| 2024 | $1,778 | $21,793 | $2,261 | $19,532 |
| 2023 | $1,657 | $19,840 | $2,058 | $17,782 |
| 2022 | $1,557 | $18,425 | $1,911 | $16,514 |
| 2021 | $1,516 | $18,042 | $1,871 | $16,171 |
| 2020 | $1,544 | $18,383 | $1,906 | $16,477 |
| 2019 | $1,506 | $17,744 | $1,575 | $16,169 |
| 2018 | $1,564 | $17,665 | $1,568 | $16,097 |
| 2017 | $1,452 | $16,969 | $1,506 | $15,463 |
| 2016 | $1,395 | $16,367 | $1,453 | $14,914 |
| 2015 | $783 | $8,972 | $1,488 | $7,484 |
| 2014 | $777 | $8,870 | $1,471 | $7,399 |
| 2013 | $783 | $8,972 | $1,488 | $7,484 |
Source: Public Records
Map
Nearby Homes
- 308 S Genesee St
- 109 E Morris St
- 105 E Knox St
- 402 W Lincolnway
- 406 S Genesee St
- 304 S Madison St
- 411 W Park St
- 302 E Park St
- 400 E Knox St
- 509 S Madison St
- 208 Johnson St
- 403 E Park St
- 503 Portland Ave
- 617 W Lincolnway
- 701 W Wall St
- 624 W Lincolnway
- 620 Hillandale Dr
- 604 Hillandale Ct
- 215 Cedar St
- 101 N Jackson St
Your Personal Tour Guide
Ask me questions while you tour the home.