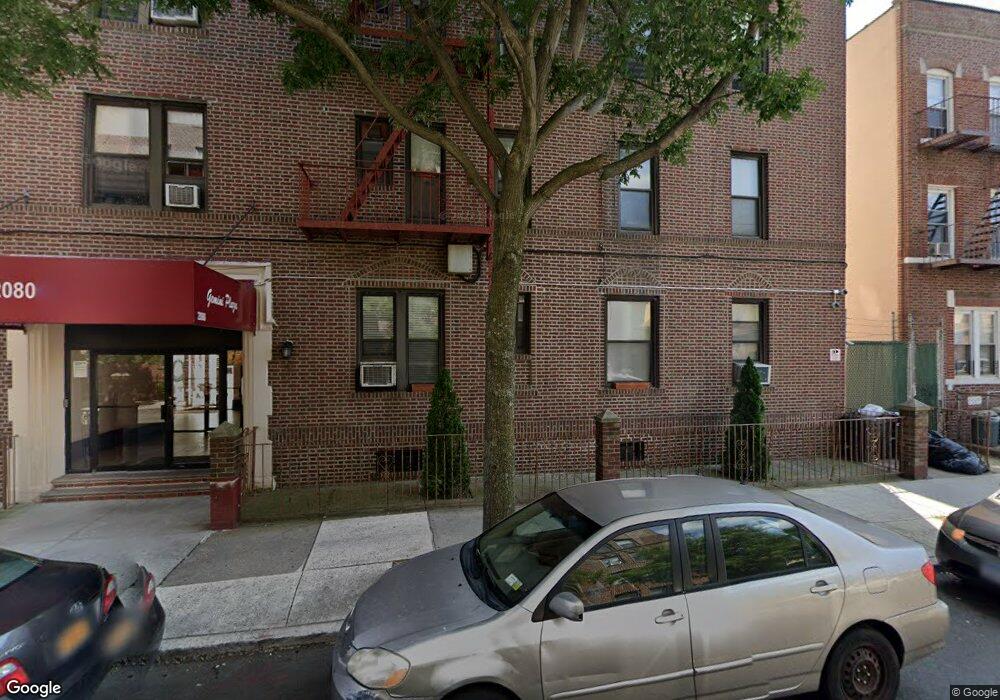
2080 77th St Unit C6 Brooklyn, NY 11214
Bensonhurst NeighborhoodEstimated Value: $423,492 - $700,000
--
Bed
--
Bath
657
Sq Ft
$855/Sq Ft
Est. Value
About This Home
This home is located at 2080 77th St Unit C6, Brooklyn, NY 11214 and is currently estimated at $561,873, approximately $855 per square foot. 2080 77th St Unit C6 is a home located in Kings County with nearby schools including P.S. 186 Dr. Irving A. Gladstone Elementary School, Seth Low Intermediate School 96, and James Madison High School.
Ownership History
Date
Name
Owned For
Owner Type
Purchase Details
Closed on
May 15, 2015
Sold by
Wu Qiong Ying and Ye Zhi Cheng
Bought by
Qiong Ying Wu As Trustee and Trustee Of The Ye Family Revocable Trust
Current Estimated Value
Purchase Details
Closed on
Jul 6, 2009
Sold by
Fung Wai Yin
Bought by
Wu Qiong Ying and Ye Zhi Cheng
Purchase Details
Closed on
Aug 27, 2007
Sold by
Fung Wai Yin and Kwong Caman Ka
Bought by
Fung Wai Yin
Purchase Details
Closed on
Apr 19, 2000
Sold by
Yee Chiu Keung and Lin L
Bought by
Fung Wai Yin and Kwong Caman Ka
Purchase Details
Closed on
Feb 15, 1996
Sold by
Yiu Jennifer Oi Lei and Yiu Yuet Heung
Bought by
Yee Chiu Keung and Lin L
Home Financials for this Owner
Home Financials are based on the most recent Mortgage that was taken out on this home.
Original Mortgage
$60,000
Interest Rate
6.47%
Mortgage Type
Purchase Money Mortgage
Create a Home Valuation Report for This Property
The Home Valuation Report is an in-depth analysis detailing your home's value as well as a comparison with similar homes in the area
Home Values in the Area
Average Home Value in this Area
Purchase History
| Date | Buyer | Sale Price | Title Company |
|---|---|---|---|
| Qiong Ying Wu As Trustee | -- | -- | |
| Qiong Ying Wu As Trustee | -- | -- | |
| Wu Qiong Ying | $220,000 | -- | |
| Wu Qiong Ying | $220,000 | -- | |
| Fung Wai Yin | -- | -- | |
| Fung Wai Yin | -- | -- | |
| Fung Wai Yin | $100,000 | -- | |
| Fung Wai Yin | $100,000 | -- | |
| Yee Chiu Keung | $80,000 | -- | |
| Yee Chiu Keung | $80,000 | -- |
Source: Public Records
Mortgage History
| Date | Status | Borrower | Loan Amount |
|---|---|---|---|
| Previous Owner | Yee Chiu Keung | $60,000 |
Source: Public Records
Tax History Compared to Growth
Tax History
| Year | Tax Paid | Tax Assessment Tax Assessment Total Assessment is a certain percentage of the fair market value that is determined by local assessors to be the total taxable value of land and additions on the property. | Land | Improvement |
|---|---|---|---|---|
| 2025 | $3,884 | $39,718 | $3,877 | $35,841 |
| 2024 | $3,884 | $38,384 | $3,877 | $34,507 |
| 2023 | $2,606 | $34,770 | $3,877 | $30,893 |
| 2022 | $1,463 | $32,444 | $3,877 | $28,567 |
| 2021 | $1,396 | $28,908 | $3,877 | $25,031 |
| 2020 | $12 | $30,770 | $3,877 | $26,893 |
| 2019 | $3,257 | $30,770 | $3,877 | $26,893 |
| 2018 | $3,078 | $28,257 | $3,877 | $24,380 |
| 2017 | $2,966 | $28,723 | $3,878 | $24,845 |
| 2016 | $2,685 | $27,653 | $3,878 | $23,775 |
| 2015 | $1,505 | $25,403 | $3,877 | $21,526 |
| 2014 | $1,505 | $22,627 | $3,877 | $18,750 |
Source: Public Records
Map
Nearby Homes
- 2055 77th St
- 7615 21st Ave
- 2039 78th St
- 2125 77th St
- 2101 76th St
- 2112 Bay Ridge Pkwy
- 2172 76th St
- 7620 Bay Pkwy Unit 4B
- 7616 Bay Pkwy Unit 5-B
- 7616 Bay Pkwy Unit PH-A
- 7616 Bay Pkwy Unit 3-A
- 7608 Bay Pkwy Unit 5C
- 7913 20th Ave
- 2024 80th St
- 7516 Bay Pkwy Unit 2E
- 2150 80th St
- 7420 20th Ave
- 7312 21st Ave
- 7819 Bay Pkwy Unit PH
- 2153 81st St Unit 2A
- 2080 77th St Unit A2
- 2080 77th St Unit D8
- 2080 77th St Unit D6
- 2080 77th St Unit D5
- 2080 77th St Unit D4
- 2080 77th St Unit D3
- 2080 77th St Unit D2
- 2080 77th St Unit D1
- 2080 77th St Unit C8
- 2080 77th St Unit C5
- 2080 77th St Unit C4
- 2080 77th St Unit C3
- 2080 77th St Unit C2
- 2080 77th St Unit C1
- 2080 77th St Unit B8
- 2080 77th St Unit B6
- 2080 77th St Unit B5
- 2080 77th St Unit B4
- 2080 77th St Unit B3
- 2080 77th St Unit B2