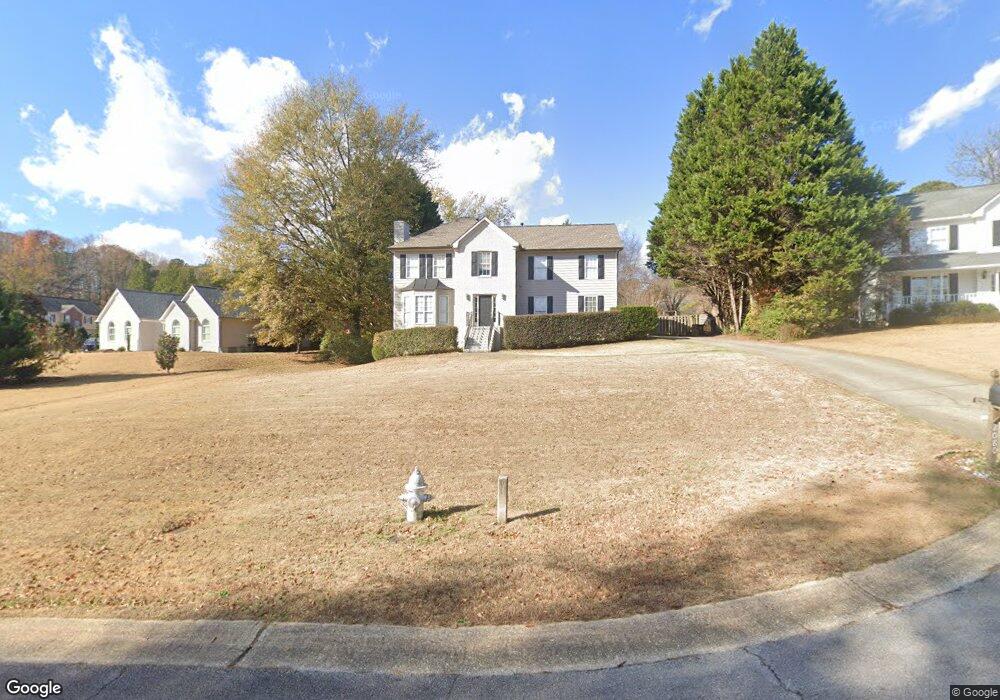
2080 Celeste Trail Buford, GA 30519
Estimated Value: $428,819 - $486,000
4
Beds
3
Baths
3,292
Sq Ft
$138/Sq Ft
Est. Value
About This Home
This home is located at 2080 Celeste Trail, Buford, GA 30519 and is currently estimated at $452,705, approximately $137 per square foot. 2080 Celeste Trail is a home located in Gwinnett County with nearby schools including Patrick Elementary School, Glenn C. Jones Middle School, and Sugar Hill Christian Academy.
Ownership History
Date
Name
Owned For
Owner Type
Purchase Details
Closed on
Dec 23, 2009
Sold by
Bank Of America Na 2006-He7
Bought by
Dymant Louis D
Current Estimated Value
Home Financials for this Owner
Home Financials are based on the most recent Mortgage that was taken out on this home.
Original Mortgage
$164,465
Outstanding Balance
$109,184
Interest Rate
5.25%
Mortgage Type
FHA
Estimated Equity
$343,521
Purchase Details
Closed on
Oct 6, 2009
Sold by
Holiman Chad M and Holiman Lauralee
Bought by
Lasalle Bk Na Gsamp 2006-He7
Purchase Details
Closed on
Sep 1, 2006
Sold by
Campbell John K and Campbell Donna M
Bought by
Holiman Chad M and Holiman Lauralee
Home Financials for this Owner
Home Financials are based on the most recent Mortgage that was taken out on this home.
Original Mortgage
$39,200
Interest Rate
6.58%
Mortgage Type
Stand Alone Refi Refinance Of Original Loan
Create a Home Valuation Report for This Property
The Home Valuation Report is an in-depth analysis detailing your home's value as well as a comparison with similar homes in the area
Home Values in the Area
Average Home Value in this Area
Purchase History
| Date | Buyer | Sale Price | Title Company |
|---|---|---|---|
| Dymant Louis D | $167,500 | -- | |
| Lasalle Bk Na Gsamp 2006-He7 | $165,000 | -- | |
| Holiman Chad M | $196,000 | -- |
Source: Public Records
Mortgage History
| Date | Status | Borrower | Loan Amount |
|---|---|---|---|
| Open | Dymant Louis D | $164,465 | |
| Previous Owner | Holiman Chad M | $39,200 |
Source: Public Records
Tax History Compared to Growth
Tax History
| Year | Tax Paid | Tax Assessment Tax Assessment Total Assessment is a certain percentage of the fair market value that is determined by local assessors to be the total taxable value of land and additions on the property. | Land | Improvement |
|---|---|---|---|---|
| 2024 | $4,166 | $134,480 | $25,200 | $109,280 |
| 2023 | $4,166 | $134,480 | $25,200 | $109,280 |
| 2022 | $4,129 | $134,480 | $25,200 | $109,280 |
| 2021 | $3,788 | $115,280 | $20,800 | $94,480 |
| 2020 | $3,814 | $115,280 | $20,800 | $94,480 |
| 2019 | $3,578 | $109,320 | $20,800 | $88,520 |
| 2018 | $3,583 | $109,320 | $20,800 | $88,520 |
| 2016 | $3,200 | $90,720 | $17,600 | $73,120 |
| 2015 | $2,399 | $63,560 | $11,200 | $52,360 |
| 2014 | -- | $63,560 | $11,200 | $52,360 |
Source: Public Records
Map
Nearby Homes
- 3380 Coles Creek Dr
- 3410 Coles Creek Dr
- 3534 Fallen Oak Ln
- 2148 Splitrail Trail
- 2123 Mill Garden Run
- 2275 Copper Trail Ln
- 2182 Misty Brook Ct
- 1970 Sturbridge Ln Unit 1
- 3573 Fallen Oak Dr
- 2106 Mill Garden Run
- 3267 Mill Springs Cir
- 3263 Mill Springs Cir NE
- 2320 Copper Trail Ln
- 3560 Hanover Dr
- 3282 Mill Springs Cir
- 3160 Mill Springs Cir NE
- 2272 Misty Brook Ct
- 4152 Adler Cir
- 3325 Coles Creek Dr
- 2090 Celeste Trail
- 0 Celeste Trail Unit 7347120
- 0 Celeste Trail Unit 7282290
- 0 Celeste Trail Unit 8221479
- 0 Celeste Trail
- 2081 Cherokee Farms Cove
- 2100 Celeste Trail
- 2071 Cherokee Farms Cove
- 2095 Celeste Trail
- 2061 Cherokee Farms Cove
- 0 Cherokee Farms Cove
- 3320 Coles Creek Dr
- 2085 Celeste Trail
- 3330 Coles Creek Dr
- 3330 Coles Creek Dr Unit 4
- 2105 Celeste Trail
- 3305 Coles Creek Dr
- 3340 Coles Creek Dr
- 2091 Cherokee Farms Cove