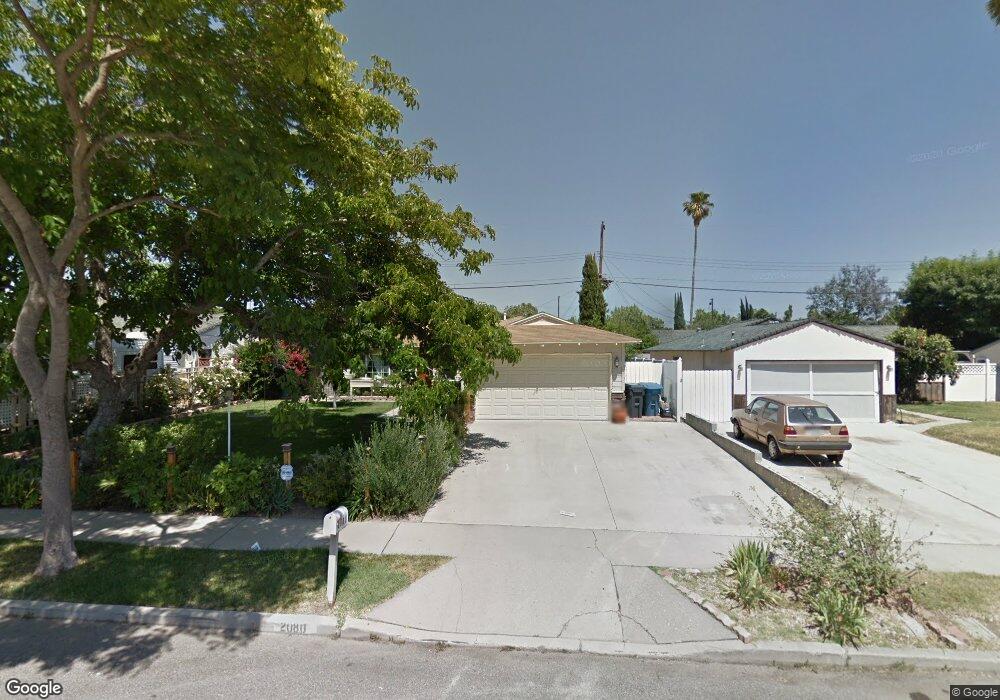
2080 Lupin St Simi Valley, CA 93065
Central Simi Valley NeighborhoodEstimated Value: $687,000 - $783,000
3
Beds
2
Baths
1,054
Sq Ft
$708/Sq Ft
Est. Value
About This Home
This home is located at 2080 Lupin St, Simi Valley, CA 93065 and is currently estimated at $746,727, approximately $708 per square foot. 2080 Lupin St is a home located in Ventura County with nearby schools including Park View Elementary School, Hillside Middle School, and Royal High School.
Ownership History
Date
Name
Owned For
Owner Type
Purchase Details
Closed on
Jan 9, 2015
Sold by
Tliche Atef Alex
Bought by
Tliche Alex
Current Estimated Value
Purchase Details
Closed on
Oct 12, 2005
Sold by
Alden Jeffrey and Johnson Christine
Bought by
Tliche Atef Alex
Home Financials for this Owner
Home Financials are based on the most recent Mortgage that was taken out on this home.
Original Mortgage
$100,000
Interest Rate
5.48%
Mortgage Type
Stand Alone Second
Purchase Details
Closed on
Feb 24, 2003
Sold by
Sanders Elizabeth J
Bought by
Alden Jeffrey and Johnson Christine T
Home Financials for this Owner
Home Financials are based on the most recent Mortgage that was taken out on this home.
Original Mortgage
$231,200
Interest Rate
6.62%
Purchase Details
Closed on
Feb 1, 2001
Sold by
Sanders Elizabeth J
Bought by
Sanders Elizabeth J
Create a Home Valuation Report for This Property
The Home Valuation Report is an in-depth analysis detailing your home's value as well as a comparison with similar homes in the area
Home Values in the Area
Average Home Value in this Area
Purchase History
| Date | Buyer | Sale Price | Title Company |
|---|---|---|---|
| Tliche Alex | -- | None Available | |
| Tliche Atef Alex | $500,000 | Chicago Title Company | |
| Alden Jeffrey | $289,000 | Old Republic Title Ins Co | |
| Sanders Elizabeth J | -- | -- |
Source: Public Records
Mortgage History
| Date | Status | Borrower | Loan Amount |
|---|---|---|---|
| Closed | Tliche Atef Alex | $100,000 | |
| Open | Tliche Atef Alex | $400,000 | |
| Previous Owner | Alden Jeffrey | $231,200 | |
| Closed | Alden Jeffrey | $57,800 |
Source: Public Records
Tax History Compared to Growth
Tax History
| Year | Tax Paid | Tax Assessment Tax Assessment Total Assessment is a certain percentage of the fair market value that is determined by local assessors to be the total taxable value of land and additions on the property. | Land | Improvement |
|---|---|---|---|---|
| 2025 | $7,041 | $579,600 | $325,856 | $253,744 |
| 2024 | $7,041 | $568,236 | $319,467 | $248,769 |
| 2023 | $6,622 | $557,095 | $313,203 | $243,892 |
| 2022 | $6,604 | $546,172 | $307,062 | $239,110 |
| 2021 | $6,563 | $535,463 | $301,041 | $234,422 |
| 2020 | $5,958 | $487,000 | $274,000 | $213,000 |
| 2019 | $5,812 | $489,000 | $275,000 | $214,000 |
| 2018 | $5,850 | $487,000 | $274,000 | $213,000 |
| 2017 | $5,345 | $443,000 | $249,000 | $194,000 |
| 2016 | $4,975 | $422,000 | $237,000 | $185,000 |
| 2015 | $4,586 | $396,000 | $258,000 | $138,000 |
| 2014 | $4,354 | $373,000 | $243,000 | $130,000 |
Source: Public Records
Map
Nearby Homes
- 2149 Clover St
- 2090 Sycamore Dr
- 2730 Niles St
- 2320 Lupin St
- 2149 Madrone St
- 2306 Madrone St
- 2886 Galena Ave
- 2405 Lee St
- 2349 Knollhaven St
- 2442 N Alden St
- 3045 Galena Ave
- 2391 Heather St
- 3064 Galena Ave
- 1775 Lee St
- 3082 Galena Ave
- 2266 Lansdale Ct
- 2241 Burnside St
- 2355 E Alden St
- 2368 Heywood St
- 2163 N Justin Ave