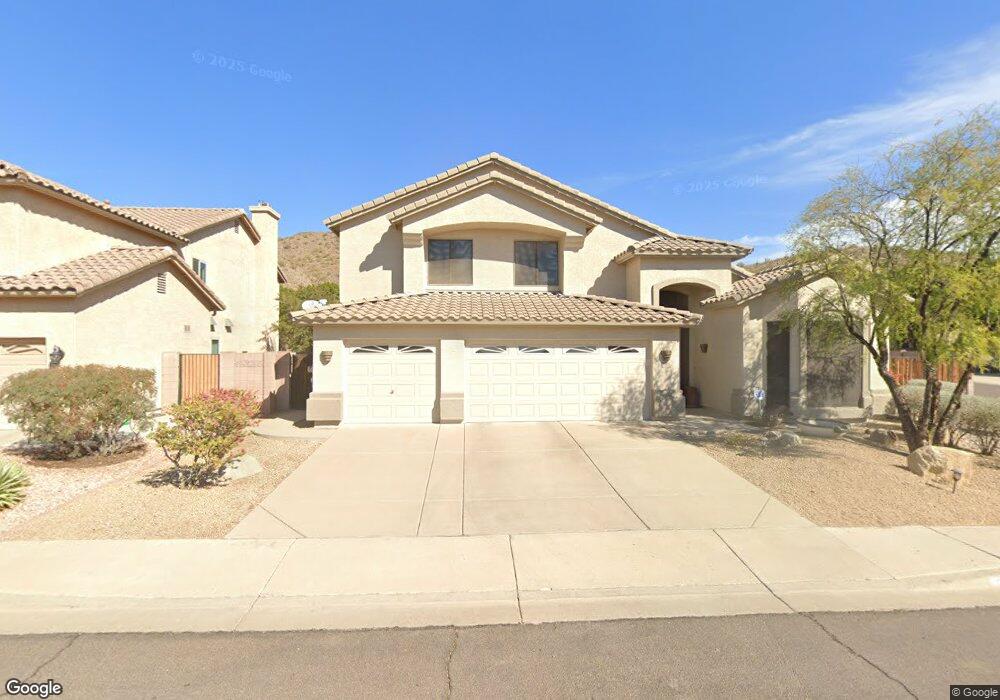
20803 N 17th St Phoenix, AZ 85024
Desert View NeighborhoodEstimated Value: $682,023 - $784,000
Studio
3
Baths
2,954
Sq Ft
$253/Sq Ft
Est. Value
About This Home
This home is located at 20803 N 17th St, Phoenix, AZ 85024 and is currently estimated at $748,756, approximately $253 per square foot. 20803 N 17th St is a home located in Maricopa County with nearby schools including Boulder Creek Elementary School, Mountain Trail Middle School, and Pinnacle High School.
Ownership History
Date
Name
Owned For
Owner Type
Purchase Details
Closed on
Jan 22, 2002
Sold by
Countrymen Susan
Bought by
Countrymen Christopher C
Current Estimated Value
Home Financials for this Owner
Home Financials are based on the most recent Mortgage that was taken out on this home.
Original Mortgage
$212,000
Outstanding Balance
$87,434
Interest Rate
7.17%
Estimated Equity
$661,322
Purchase Details
Closed on
Apr 19, 1999
Sold by
Cheskaty Jack B and Cheskaty Sharon K
Bought by
Countrymen Christopher C and Countrymen Susan
Home Financials for this Owner
Home Financials are based on the most recent Mortgage that was taken out on this home.
Original Mortgage
$162,500
Interest Rate
6.86%
Purchase Details
Closed on
Oct 20, 1997
Sold by
Pulte Home Corp
Bought by
Cheskaty Jack B and Cheskaty Sharon K
Home Financials for this Owner
Home Financials are based on the most recent Mortgage that was taken out on this home.
Original Mortgage
$197,050
Interest Rate
7.36%
Mortgage Type
New Conventional
Create a Home Valuation Report for This Property
The Home Valuation Report is an in-depth analysis detailing your home's value as well as a comparison with similar homes in the area
Home Values in the Area
Average Home Value in this Area
Purchase History
| Date | Buyer | Sale Price | Title Company |
|---|---|---|---|
| Countrymen Christopher C | -- | -- | |
| Countrymen Christopher C | $237,500 | Transnation Title Ins Co | |
| Cheskaty Jack B | $218,980 | Security Title Agency |
Source: Public Records
Mortgage History
| Date | Status | Borrower | Loan Amount |
|---|---|---|---|
| Open | Countrymen Christopher C | $212,000 | |
| Closed | Countrymen Christopher C | $162,500 | |
| Previous Owner | Cheskaty Jack B | $197,050 |
Source: Public Records
Tax History
| Year | Tax Paid | Tax Assessment Tax Assessment Total Assessment is a certain percentage of the fair market value that is determined by local assessors to be the total taxable value of land and additions on the property. | Land | Improvement |
|---|---|---|---|---|
| 2025 | $3,795 | $43,008 | -- | -- |
| 2024 | $3,591 | $40,960 | -- | -- |
| 2023 | $3,591 | $53,020 | $10,600 | $42,420 |
| 2022 | $3,549 | $41,110 | $8,220 | $32,890 |
| 2021 | $3,571 | $38,520 | $7,700 | $30,820 |
| 2020 | $3,449 | $38,320 | $7,660 | $30,660 |
| 2019 | $3,464 | $37,410 | $7,480 | $29,930 |
| 2018 | $3,338 | $36,130 | $7,220 | $28,910 |
| 2017 | $3,188 | $33,860 | $6,770 | $27,090 |
| 2016 | $3,137 | $32,980 | $6,590 | $26,390 |
| 2015 | $2,911 | $31,420 | $6,280 | $25,140 |
Source: Public Records
Map
Nearby Homes
- 21009 N 16th Way
- 1609 E Mohawk Ln
- 2548 E Villa Linda Dr
- 24830 N 26th St
- 2531 E Villa Linda Dr
- 2437 E Villa Linda Dr
- 2445 E Villa Linda Dr
- 2544 E Villa Linda Dr
- 2535 E Villa Linda Dr
- 1725 E Quail Ave
- 1623 E Runion Dr
- 1625 E Montoya Ln
- 1701 E Yukon Dr
- 1017 E Montoya Ln
- 1723 E Pontiac Dr
- 1516 E Marco Polo Rd
- 1442 E Marco Polo Rd
- 1226 E Wahalla Ln
- 910 E Potter Dr
- 922 E Blackhawk Dr
- 1708 E Monona Dr
- 1701 E Monona Dr
- 1705 E Monona Dr
- 1712 E Monona Dr
- 20817 N 17th St
- 20677 N 16th Way Unit VIEWS!
- 1640 E Monona Dr
- 1709 E Monona Dr
- 1717 E Ross Ave
- 1718 E Monona Dr
- 20671 N 16th Way
- 20825 N 17th St
- 1706 E Samuel Dr
- 1715 E Monona Dr
- 1723 E Ross Ave
- 1710 E Samuel Dr
- 1645 E Ross Ave
- 1716 E Samuel Dr
- 1724 E Monona Dr
- 1634 E Monona Dr