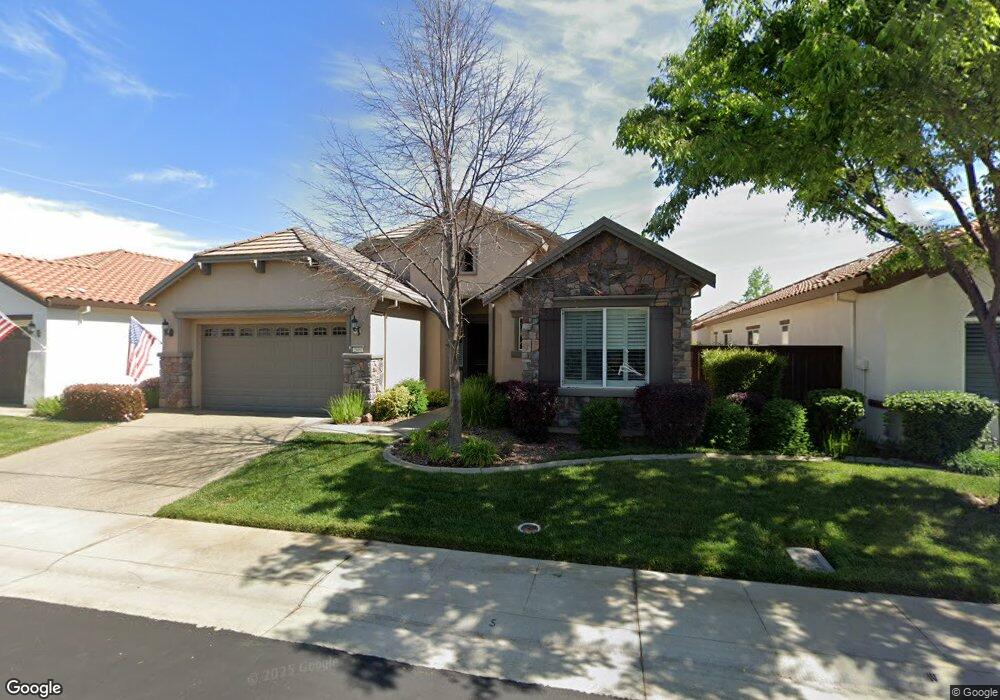
2081 Land End Loop Roseville, CA 95747
Estimated Value: $571,789 - $630,000
3
Beds
2
Baths
1,992
Sq Ft
$301/Sq Ft
Est. Value
About This Home
This home is located at 2081 Land End Loop, Roseville, CA 95747 and is currently estimated at $599,947, approximately $301 per square foot. 2081 Land End Loop is a home located in Placer County with nearby schools including Junction Elementary, Barbara Chilton Middle School, and West Park High School.
Ownership History
Date
Name
Owned For
Owner Type
Purchase Details
Closed on
Jul 20, 2020
Sold by
Stevenson Phillip Thomas and Stevenson Joni Denise
Bought by
Stevenson Phillip T and Stevenson Joni D
Current Estimated Value
Home Financials for this Owner
Home Financials are based on the most recent Mortgage that was taken out on this home.
Original Mortgage
$218,000
Outstanding Balance
$193,667
Interest Rate
3.2%
Mortgage Type
New Conventional
Estimated Equity
$406,280
Purchase Details
Closed on
Dec 19, 2017
Sold by
Stevenson Phillip T and Stevenson Joni D
Bought by
Stevenson Philip T and Stevenson Joni D
Purchase Details
Closed on
Jul 17, 2009
Sold by
Pulte Home Corporation
Bought by
Stevenson Philip T and Stevenson Joni D
Home Financials for this Owner
Home Financials are based on the most recent Mortgage that was taken out on this home.
Original Mortgage
$264,000
Interest Rate
5.25%
Mortgage Type
Purchase Money Mortgage
Create a Home Valuation Report for This Property
The Home Valuation Report is an in-depth analysis detailing your home's value as well as a comparison with similar homes in the area
Home Values in the Area
Average Home Value in this Area
Purchase History
| Date | Buyer | Sale Price | Title Company |
|---|---|---|---|
| Stevenson Phillip T | -- | Chicago Title Company | |
| Stevenson Phillip Thomas | -- | Chicago Title Company | |
| Stevenson Philip T | -- | None Available | |
| Stevenson Philip T | $330,000 | First American Title Company |
Source: Public Records
Mortgage History
| Date | Status | Borrower | Loan Amount |
|---|---|---|---|
| Open | Stevenson Phillip Thomas | $218,000 | |
| Closed | Stevenson Philip T | $264,000 |
Source: Public Records
Tax History
| Year | Tax Paid | Tax Assessment Tax Assessment Total Assessment is a certain percentage of the fair market value that is determined by local assessors to be the total taxable value of land and additions on the property. | Land | Improvement |
|---|---|---|---|---|
| 2025 | $7,083 | $429,624 | $129,073 | $300,551 |
| 2023 | $7,083 | $412,943 | $124,062 | $288,881 |
| 2022 | $6,882 | $404,847 | $121,630 | $283,217 |
| 2021 | $6,712 | $396,910 | $119,246 | $277,664 |
| 2020 | $6,560 | $392,841 | $118,024 | $274,817 |
| 2019 | $6,387 | $385,139 | $115,710 | $269,429 |
| 2018 | $6,239 | $377,589 | $113,442 | $264,147 |
| 2017 | $6,127 | $370,186 | $111,218 | $258,968 |
| 2016 | $6,096 | $359,829 | $109,038 | $250,791 |
| 2015 | $6,000 | $354,425 | $107,401 | $247,024 |
| 2014 | $5,944 | $347,484 | $105,298 | $242,186 |
Source: Public Records
Map
Nearby Homes
- 2096 Land End Loop
- 2016 Land End Loop
- 2128 Land End Loop
- 1037 Billington Ln
- 3201 Monument Dr
- 2152 Xavier Ln
- 2446 Langtree Dr
- 1105 Branston Dr
- 3390 Kennerleigh Pkwy
- 2112 Leighham Dr
- 5224 Dreamgarden Loop
- 5289 Dreamgarden Loop
- 2160 Arlington Dr
- 3241 Village Center Dr
- 2032 Brixham Dr
- 2120 Arlington Dr
- 2128 Blue Coppice Way
- 325 Cabot Canyon Ct
- 317 Cabot Canyon Ct
- 309 Cabot Canyon Ct
- 2089 Land End Loop
- 2073 Land End Loop
- 2097 Land End Loop
- 2091 Shipton Dr
- 2105 Land End Loop
- 2083 Shipton Dr
- 2080 Land End Loop
- 2099 Shipton Dr
- 2065 Land End Loop
- 2107 Shipton Dr
- 2064 Land End Loop
- 2075 Shipton Dr
- 2157 Land End Loop
- 2113 Land End Loop
- 2017 Land End Loop
- 2056 Land End Loop
- 2059 Shipton Dr
- 2000 Cove Ln
- 2104 Land End Loop
- 2009 Land End Loop
Your Personal Tour Guide
Ask me questions while you tour the home.