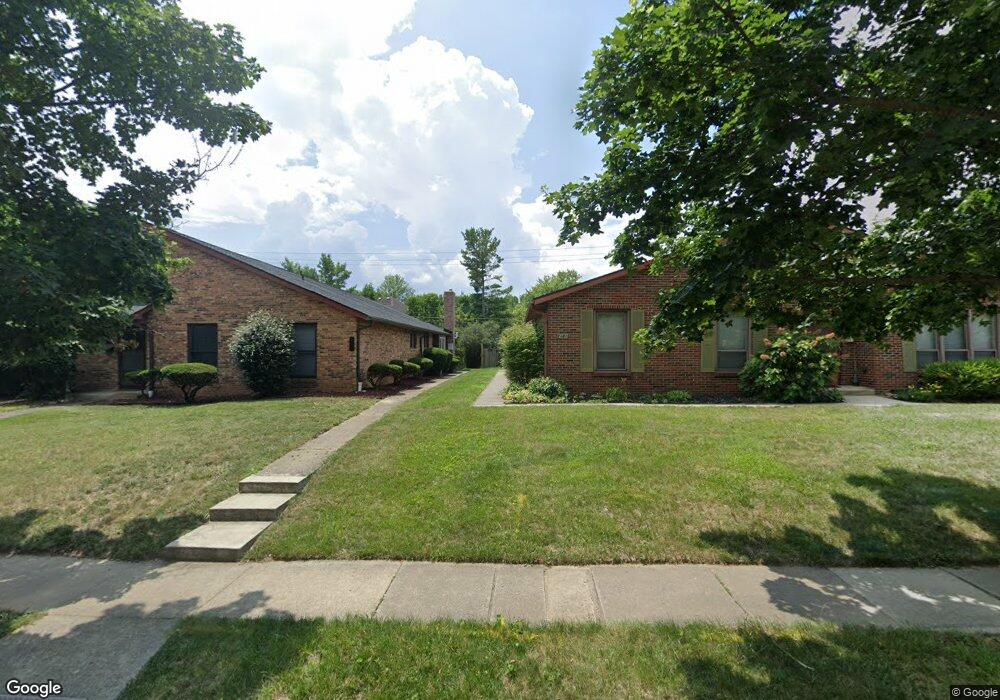
2081 Mackenzie Dr Columbus, OH 43220
Estimated Value: $258,659 - $383,000
2
Beds
2
Baths
1,150
Sq Ft
$262/Sq Ft
Est. Value
About This Home
This home is located at 2081 Mackenzie Dr, Columbus, OH 43220 and is currently estimated at $301,165, approximately $261 per square foot. 2081 Mackenzie Dr is a home located in Franklin County with nearby schools including Greensview Elementary School, Hastings Middle School, and Upper Arlington High School.
Ownership History
Date
Name
Owned For
Owner Type
Purchase Details
Closed on
Jun 28, 2021
Sold by
Buescher William and Buescher Jan
Bought by
Hopper Andrew James
Current Estimated Value
Home Financials for this Owner
Home Financials are based on the most recent Mortgage that was taken out on this home.
Original Mortgage
$165,040
Outstanding Balance
$149,748
Interest Rate
2.9%
Mortgage Type
New Conventional
Estimated Equity
$151,417
Purchase Details
Closed on
Jun 28, 2018
Sold by
Snyder Jeanette H
Bought by
Buescher William and Buescher Jan
Home Financials for this Owner
Home Financials are based on the most recent Mortgage that was taken out on this home.
Original Mortgage
$138,750
Interest Rate
4.5%
Mortgage Type
New Conventional
Purchase Details
Closed on
Apr 14, 1999
Sold by
Snyder Joseph J and Snyder Jeanette H
Bought by
Snyder Joseph J and Snyder Jeanette H
Purchase Details
Closed on
Jul 8, 1981
Bought by
Snyder Joseph J
Create a Home Valuation Report for This Property
The Home Valuation Report is an in-depth analysis detailing your home's value as well as a comparison with similar homes in the area
Home Values in the Area
Average Home Value in this Area
Purchase History
| Date | Buyer | Sale Price | Title Company |
|---|---|---|---|
| Hopper Andrew James | -- | First American Title | |
| Buescher William | $185,000 | Northwest Select Advantage T | |
| Snyder Joseph J | -- | -- | |
| Snyder Joseph J | -- | -- |
Source: Public Records
Mortgage History
| Date | Status | Borrower | Loan Amount |
|---|---|---|---|
| Open | Hopper Andrew James | $165,040 | |
| Previous Owner | Buescher William | $138,750 |
Source: Public Records
Tax History Compared to Growth
Tax History
| Year | Tax Paid | Tax Assessment Tax Assessment Total Assessment is a certain percentage of the fair market value that is determined by local assessors to be the total taxable value of land and additions on the property. | Land | Improvement |
|---|---|---|---|---|
| 2024 | $4,079 | $70,460 | $17,500 | $52,960 |
| 2023 | $4,029 | $70,455 | $17,500 | $52,955 |
| 2022 | $3,973 | $56,850 | $14,110 | $42,740 |
| 2021 | $3,596 | $56,850 | $14,110 | $42,740 |
| 2020 | $3,565 | $56,850 | $14,110 | $42,740 |
| 2019 | $3,506 | $49,420 | $12,250 | $37,170 |
| 2018 | $2,327 | $49,420 | $12,250 | $37,170 |
| 2017 | $2,325 | $49,420 | $12,250 | $37,170 |
| 2016 | $1,852 | $36,760 | $6,200 | $30,560 |
| 2015 | $1,850 | $36,760 | $6,200 | $30,560 |
| 2014 | $1,852 | $36,760 | $6,200 | $30,560 |
| 2013 | $912 | $35,000 | $5,915 | $29,085 |
Source: Public Records
Map
Nearby Homes
- 2060 Fontenay Place
- 4781 Coach Rd
- 2165 Partlow Dr
- 2198 Sandston Rd
- 2248 Sandover Rd
- 2231 Atlee Ct Unit 12
- 4720 Merrifield Place Unit 67
- 4861 Etrick Dr Unit 22
- 4450 Haverford Ct
- 1835 Willoway Cir N
- 1865 Willoway Cir N Unit 1865
- 2560 Chartwell Rd
- 4924 Reed Rd Unit B
- 1610 Lafayette Dr Unit 1610
- 1594 Lafayette Dr Unit 1594
- 1961 Ramble Branch Dr Unit 30
- 5268 Captains Ct
- 1739 Paula Dr Unit 1739
- 5000 Slate Run Woods Ct
- 1512 Lafayette Dr Unit B
- 2081 Mackenzie Dr Unit 2085
- 2085 Mackenzie Dr
- 2093 Mackenzie Dr Unit 97
- 2073 Mackenzie Dr Unit 77
- 2073 Mackenzie Dr Unit 2073-77
- 2073-2077 Mackenzie Dr
- 2093-2097 Mackenzie Dr
- 2065 Mackenzie Dr Unit 2065
- 2101 Mackenzie Dr Unit 105
- 2080 Mackenzie Dr Unit 12
- 2082 Sandover Ct
- 2074 Sandover Ct
- 2061 Mackenzie Dr
- 4725 Dierker Rd
- 2096 Sandover Ct
- 2102 Mackenzie Dr
- 4729 Dierker Rd
- 2068 Mackenzie Dr Unit 1
- 2100 Mackenzie Dr Unit 14
- 2113 Mackenzie Dr Unit 117