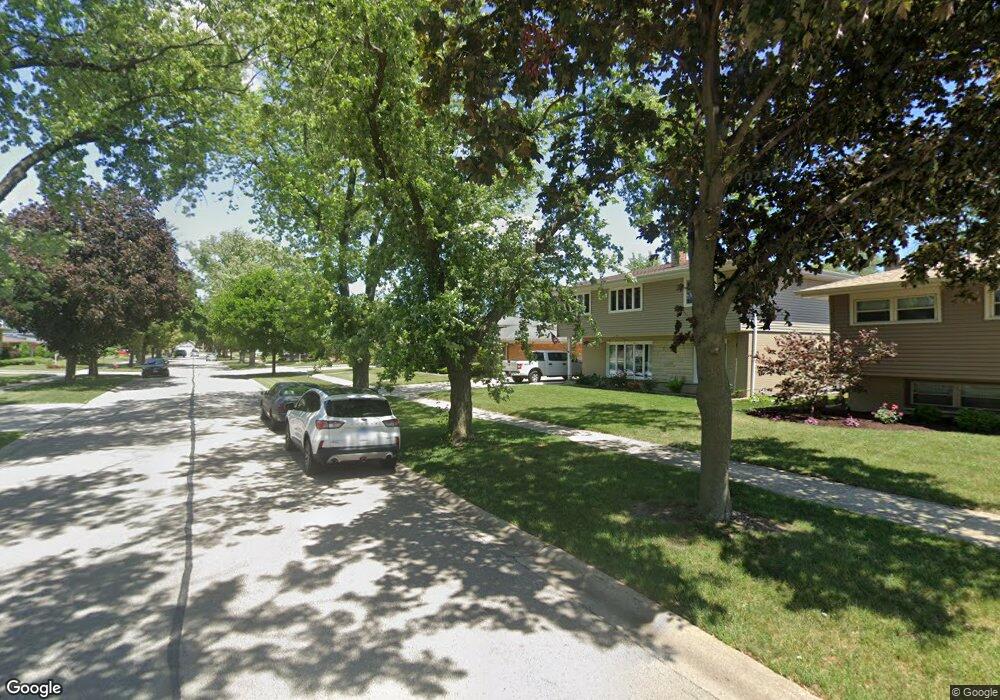
2081 Westview Dr Des Plaines, IL 60018
Estimated Value: $407,411 - $497,000
3
Beds
2
Baths
1,172
Sq Ft
$380/Sq Ft
Est. Value
About This Home
This home is located at 2081 Westview Dr, Des Plaines, IL 60018 and is currently estimated at $444,853, approximately $379 per square foot. 2081 Westview Dr is a home located in Cook County with nearby schools including Plainfield Elementary School, Algonquin Middle School, and Maine West High School.
Ownership History
Date
Name
Owned For
Owner Type
Purchase Details
Closed on
Jul 8, 2016
Sold by
Katzberg Philip H
Bought by
Katzberg Philip H and Katzberg Michelle
Current Estimated Value
Home Financials for this Owner
Home Financials are based on the most recent Mortgage that was taken out on this home.
Original Mortgage
$212,000
Outstanding Balance
$166,005
Interest Rate
3.25%
Mortgage Type
Adjustable Rate Mortgage/ARM
Estimated Equity
$278,848
Purchase Details
Closed on
Sep 11, 2008
Sold by
Oleary Kathleen A
Bought by
Katzberg Philip H
Home Financials for this Owner
Home Financials are based on the most recent Mortgage that was taken out on this home.
Original Mortgage
$240,000
Interest Rate
6.52%
Mortgage Type
Unknown
Create a Home Valuation Report for This Property
The Home Valuation Report is an in-depth analysis detailing your home's value as well as a comparison with similar homes in the area
Home Values in the Area
Average Home Value in this Area
Purchase History
| Date | Buyer | Sale Price | Title Company |
|---|---|---|---|
| Katzberg Philip H | -- | Attorney | |
| Katzberg Philip H | $300,000 | Cti |
Source: Public Records
Mortgage History
| Date | Status | Borrower | Loan Amount |
|---|---|---|---|
| Open | Katzberg Philip H | $212,000 | |
| Closed | Katzberg Philip H | $240,000 |
Source: Public Records
Tax History
| Year | Tax Paid | Tax Assessment Tax Assessment Total Assessment is a certain percentage of the fair market value that is determined by local assessors to be the total taxable value of land and additions on the property. | Land | Improvement |
|---|---|---|---|---|
| 2025 | $7,299 | $38,000 | $8,400 | $29,600 |
| 2024 | $7,299 | $31,000 | $7,000 | $24,000 |
| 2023 | $7,097 | $31,000 | $7,000 | $24,000 |
| 2022 | $7,097 | $31,000 | $7,000 | $24,000 |
| 2021 | $6,643 | $24,942 | $4,550 | $20,392 |
| 2020 | $6,600 | $24,942 | $4,550 | $20,392 |
| 2019 | $6,619 | $28,025 | $4,550 | $23,475 |
| 2018 | $5,729 | $22,592 | $4,025 | $18,567 |
| 2017 | $5,645 | $22,592 | $4,025 | $18,567 |
| 2016 | $5,584 | $22,592 | $4,025 | $18,567 |
| 2015 | $5,174 | $19,738 | $3,500 | $16,238 |
| 2014 | $5,081 | $19,738 | $3,500 | $16,238 |
| 2013 | $4,937 | $19,738 | $3,500 | $16,238 |
Source: Public Records
Map
Nearby Homes
- 635 Birchwood Ave
- 805 S Tures Ln
- 614 Birchwood Ave
- 2323 Douglas Ave
- 1370 Fargo Ave Unit E
- 664 E Oakton St
- 1541 Cooper St
- 1030 Bogart St
- 1596 Oxford Rd
- 1458 Kingston Ct
- 1080 Bogart St
- 1445 Everett Ave
- 1394 Carol Ln
- 505 Forest Ave
- 1689 S Elm St
- 1738 Lunt Ave
- 1629 E Touhy Ave
- 1509 Center St
- 1641 E Touhy Ave
- 1205 S Wolf Rd
- 2101 Westview Dr
- 2073 Westview Dr
- 2065 Westview Dr
- 2109 Westview Dr
- 2080 Plainfield Dr
- 2100 Plainfield Dr
- 2072 Plainfield Dr
- 2108 Plainfield Dr Unit 2
- 2057 Westview Dr Unit 1
- 2117 Westview Dr
- 2064 Plainfield Dr
- 2080 Westview Dr
- 2072 Westview Dr
- 2100 Westview Dr
- 2116 Plainfield Dr
- 2056 Plainfield Dr
- 2064 Westview Dr
- 2108 Westview Dr
- 2125 Westview Dr
- 2049 Westview Dr
Your Personal Tour Guide
Ask me questions while you tour the home.