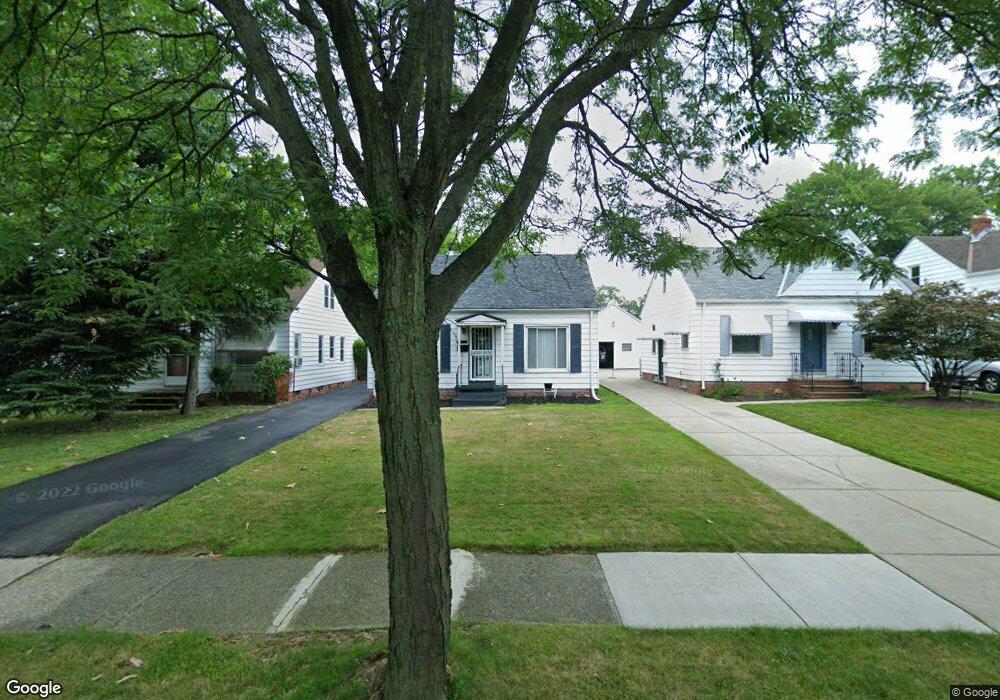
20811 Raymond St Maple Heights, OH 44137
Estimated Value: $94,000 - $112,000
3
Beds
2
Baths
1,092
Sq Ft
$97/Sq Ft
Est. Value
About This Home
This home is located at 20811 Raymond St, Maple Heights, OH 44137 and is currently estimated at $105,555, approximately $96 per square foot. 20811 Raymond St is a home located in Cuyahoga County with nearby schools including Abraham Lincoln Elementary School, Rockside/ J.F. Kennedy School, and Italy High School.
Ownership History
Date
Name
Owned For
Owner Type
Purchase Details
Closed on
Apr 4, 2023
Sold by
Eiland Raymond
Bought by
Calhoun Nicole A
Current Estimated Value
Purchase Details
Closed on
May 31, 1994
Sold by
Brooks Timothy M
Bought by
Eiland Raymond
Purchase Details
Closed on
Dec 21, 1990
Sold by
Nagy Ronald S
Bought by
Brooks Timothy M
Purchase Details
Closed on
Aug 20, 1985
Sold by
Vanover Geraldine
Bought by
Nagy Ronald S
Purchase Details
Closed on
Mar 30, 1979
Sold by
Vanover Geraldine
Bought by
Vanover Geraldine
Purchase Details
Closed on
Nov 13, 1978
Sold by
Lacy Frances
Bought by
Vanover Geraldine
Purchase Details
Closed on
Jan 1, 1975
Bought by
Lacy Frances
Create a Home Valuation Report for This Property
The Home Valuation Report is an in-depth analysis detailing your home's value as well as a comparison with similar homes in the area
Home Values in the Area
Average Home Value in this Area
Purchase History
| Date | Buyer | Sale Price | Title Company |
|---|---|---|---|
| Calhoun Nicole A | -- | None Listed On Document | |
| Eiland Raymond | $73,900 | -- | |
| Brooks Timothy M | $68,000 | -- | |
| Nagy Ronald S | $52,500 | -- | |
| Vanover Geraldine | $17,500 | -- | |
| Vanover Geraldine | $35,000 | -- | |
| Lacy Frances | -- | -- |
Source: Public Records
Tax History Compared to Growth
Tax History
| Year | Tax Paid | Tax Assessment Tax Assessment Total Assessment is a certain percentage of the fair market value that is determined by local assessors to be the total taxable value of land and additions on the property. | Land | Improvement |
|---|---|---|---|---|
| 2024 | $2,910 | $31,815 | $6,965 | $24,850 |
| 2023 | $2,098 | $19,180 | $3,990 | $15,190 |
| 2022 | $2,091 | $19,180 | $3,990 | $15,190 |
| 2021 | $2,225 | $19,180 | $3,990 | $15,190 |
| 2020 | $1,909 | $14,530 | $3,010 | $11,520 |
| 2019 | $1,897 | $41,500 | $8,600 | $32,900 |
| 2018 | $1,781 | $14,530 | $3,010 | $11,520 |
| 2017 | $1,815 | $13,550 | $2,800 | $10,750 |
| 2016 | $1,756 | $13,550 | $2,800 | $10,750 |
| 2015 | $1,748 | $13,550 | $2,800 | $10,750 |
| 2014 | $1,748 | $14,880 | $3,080 | $11,800 |
Source: Public Records
Map
Nearby Homes
- 20814 Watson Rd
- 20907 Watson Rd
- 20715 Watson Rd
- 21102 Raymond St
- 21207 Franklin Rd
- 20120 Mccracken Rd
- 20814 Kenyon Dr
- 20701 Kenyon Dr
- 20510 Mountville Dr
- 21416 Gardenview Dr
- 20107 Libby Rd
- 19807 Gardenview Dr
- 19806 Mountville Dr
- 19520 Maple Heights Blvd
- 19812 Stockton Ave
- 19309 Nitra Ave
- 5165 Camden Rd
- 19289 Stafford Ave
- 5285 Mardale Ave
- 5301 Mardale Ave
- 20815 Raymond St
- 20807 Raymond St
- 20819 Raymond St
- 20803 Raymond St
- 20719 Raymond St
- 20810 Watson Rd
- 20903 Raymond St
- 20806 Watson Rd
- 20818 Watson Rd
- 20802 Watson Rd
- 20715 Raymond St
- 20902 Watson Rd
- 20718 Watson Rd
- 20810 Raymond St
- 20806 Raymond St
- 20814 Raymond St
- 20909 Raymond St
- 20802 Raymond St
- 20711 Raymond St
- 20906 Watson Rd