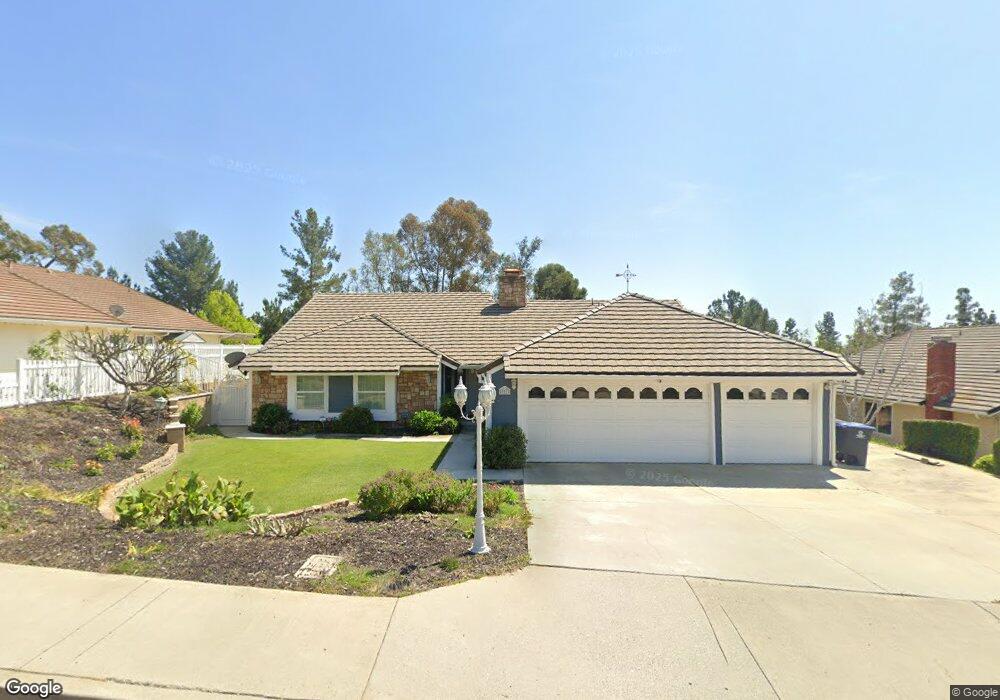
20820 Chateau Ave Yorba Linda, CA 92886
Estimated Value: $1,366,000 - $1,511,000
4
Beds
2
Baths
2,226
Sq Ft
$651/Sq Ft
Est. Value
About This Home
This home is located at 20820 Chateau Ave, Yorba Linda, CA 92886 and is currently estimated at $1,450,196, approximately $651 per square foot. 20820 Chateau Ave is a home located in Orange County with nearby schools including Fairmont Elementary, Bernardo Yorba Middle School, and Yorba Linda High School.
Ownership History
Date
Name
Owned For
Owner Type
Purchase Details
Closed on
May 28, 2024
Sold by
Becker Paul and Becker Virginia
Bought by
Paul And Virginia Becker Family Trust and Becker
Current Estimated Value
Purchase Details
Closed on
Aug 11, 1999
Sold by
Ron Jones and Ron Judy
Bought by
Becker Paul E and Becker Virginia S
Home Financials for this Owner
Home Financials are based on the most recent Mortgage that was taken out on this home.
Original Mortgage
$278,000
Interest Rate
7.89%
Purchase Details
Closed on
Feb 22, 1996
Sold by
Jones Judy Ann and Duchesne Judy Ann
Bought by
Jones Ron and Jones Judy Ann
Home Financials for this Owner
Home Financials are based on the most recent Mortgage that was taken out on this home.
Original Mortgage
$221,250
Interest Rate
7.37%
Create a Home Valuation Report for This Property
The Home Valuation Report is an in-depth analysis detailing your home's value as well as a comparison with similar homes in the area
Home Values in the Area
Average Home Value in this Area
Purchase History
| Date | Buyer | Sale Price | Title Company |
|---|---|---|---|
| Paul And Virginia Becker Family Trust | -- | None Listed On Document | |
| Becker Paul | -- | None Listed On Document | |
| Becker Paul E | $347,500 | Orange Coast Title | |
| Jones Ron | -- | California Counties Title Co |
Source: Public Records
Mortgage History
| Date | Status | Borrower | Loan Amount |
|---|---|---|---|
| Previous Owner | Becker Paul E | $278,000 | |
| Previous Owner | Jones Ron | $221,250 |
Source: Public Records
Tax History Compared to Growth
Tax History
| Year | Tax Paid | Tax Assessment Tax Assessment Total Assessment is a certain percentage of the fair market value that is determined by local assessors to be the total taxable value of land and additions on the property. | Land | Improvement |
|---|---|---|---|---|
| 2025 | $6,549 | $534,091 | $277,360 | $256,731 |
| 2024 | $6,549 | $523,619 | $271,921 | $251,698 |
| 2023 | $6,420 | $513,352 | $266,589 | $246,763 |
| 2022 | $6,325 | $503,287 | $261,362 | $241,925 |
| 2021 | $6,202 | $493,419 | $256,237 | $237,182 |
| 2020 | $6,086 | $488,360 | $253,610 | $234,750 |
| 2019 | $5,884 | $478,785 | $248,637 | $230,148 |
| 2018 | $5,801 | $469,398 | $243,762 | $225,636 |
| 2017 | $5,702 | $460,195 | $238,983 | $221,212 |
| 2016 | $5,588 | $451,172 | $234,297 | $216,875 |
| 2015 | $5,520 | $444,395 | $230,777 | $213,618 |
| 2014 | $5,351 | $435,690 | $226,256 | $209,434 |
Source: Public Records
Map
Nearby Homes
- 3862 Ravenswood Dr
- 3635 Banyon Rim Rd
- 4152 Beech Ave
- 21290 Clear Haven Dr
- 4090 Naples Ct
- 3971 Hollow Ridge Ct
- 3610 Windsong Cir
- 21590 Via Pepita
- 20681 Via Amarilla
- 3695 Blue Gum Dr
- 21451 Cloud Ridge
- 4418 Avenida Del Este
- 4362 Via Alegre
- 20100 Livorno Ln
- 20000 Villa Torino
- 4066 Villa Quintana
- 20660 Calle Feliz
- Cielo Vista 3 Plan at Cielo Vista
- Cielo Vista Plan at Cielo Vista
- Cielo Vista 4 Plan at Cielo Vista
- 20800 Chateau Ave
- 20840 Chateau Ave
- 20780 Chateau Ave
- 20860 Chateau Ave
- 20805 Chateau Ave
- 20815 Chateau Ave
- 20885 Chateau Ave
- 20760 Chateau Ave
- 20880 Chateau Ave
- 4069 Live Oak Ln
- 4065 Live Oak Ln
- 20740 Chateau Ave
- 3810 Singingwood Dr
- 3800 Singingwood Dr
- 3820 Singingwood Dr
- 20900 Chateau Ave
- 20848 Fallen Leaf Rd
- 20852 Fallen Leaf Rd
- 3790 Singingwood Dr
- 20844 Fallen Leaf Rd