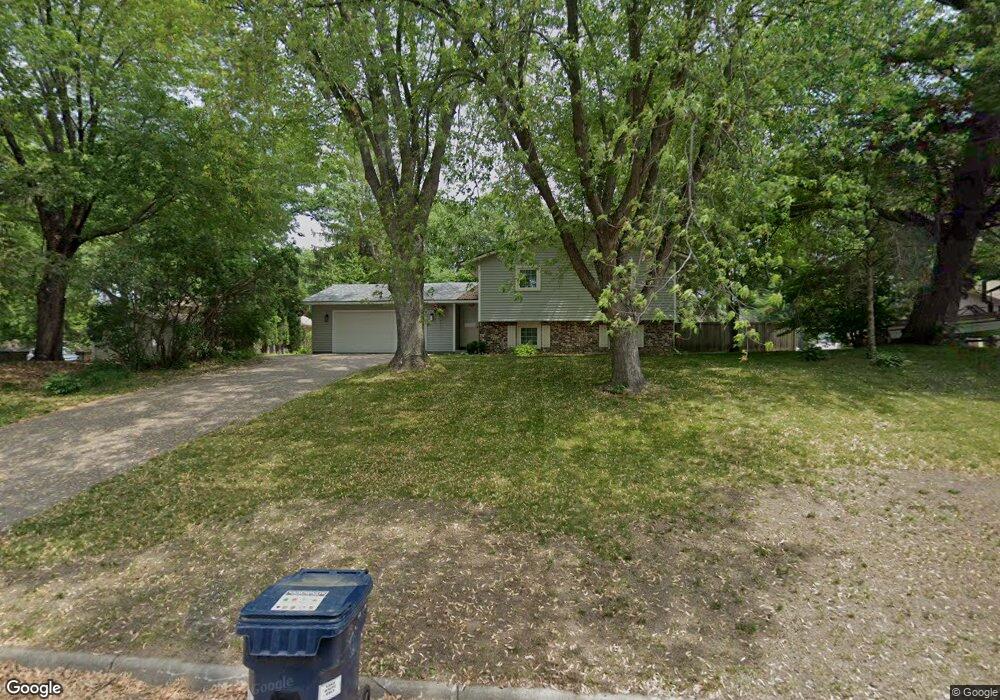
20828 Isle Ave Lakeville, MN 55044
Estimated Value: $363,000 - $421,452
4
Beds
2
Baths
1,922
Sq Ft
$207/Sq Ft
Est. Value
About This Home
This home is located at 20828 Isle Ave, Lakeville, MN 55044 and is currently estimated at $398,113, approximately $207 per square foot. 20828 Isle Ave is a home located in Dakota County with nearby schools including Lakeview Elementary School, Mcguire Middle School, and Lakeville South High School.
Ownership History
Date
Name
Owned For
Owner Type
Purchase Details
Closed on
Oct 27, 2020
Sold by
Larson Jeffrey A and Larson Constance R
Bought by
Sosa Michael Andrew S and Sosa Anna Christina
Current Estimated Value
Home Financials for this Owner
Home Financials are based on the most recent Mortgage that was taken out on this home.
Original Mortgage
$279,500
Outstanding Balance
$248,715
Interest Rate
2.8%
Mortgage Type
New Conventional
Estimated Equity
$149,398
Purchase Details
Closed on
May 15, 2007
Sold by
Docken Heather M and Walsh James F
Bought by
Larson Jeffrey A
Purchase Details
Closed on
Dec 3, 2004
Sold by
Purdes Donald J and Purdes Kathleen
Bought by
Walsh James F and Walsh Heather M
Purchase Details
Closed on
Aug 17, 2001
Sold by
Norris David and Norris Molly
Bought by
Purdes Donald J and Purdes Kathleen M
Purchase Details
Closed on
Jun 30, 1999
Sold by
Bradford Robert G and Bradford Dawn M
Bought by
Norris David and Norris Molly
Create a Home Valuation Report for This Property
The Home Valuation Report is an in-depth analysis detailing your home's value as well as a comparison with similar homes in the area
Home Values in the Area
Average Home Value in this Area
Purchase History
| Date | Buyer | Sale Price | Title Company |
|---|---|---|---|
| Sosa Michael Andrew S | $299,900 | Regis Title Llc | |
| Larson Jeffrey A | $265,000 | -- | |
| Walsh James F | $264,000 | -- | |
| Purdes Donald J | $200,000 | -- | |
| Norris David | $152,000 | -- |
Source: Public Records
Mortgage History
| Date | Status | Borrower | Loan Amount |
|---|---|---|---|
| Open | Sosa Michael Andrew S | $279,500 |
Source: Public Records
Tax History Compared to Growth
Tax History
| Year | Tax Paid | Tax Assessment Tax Assessment Total Assessment is a certain percentage of the fair market value that is determined by local assessors to be the total taxable value of land and additions on the property. | Land | Improvement |
|---|---|---|---|---|
| 2024 | $4,342 | $409,600 | $90,700 | $318,900 |
| 2023 | $4,342 | $398,800 | $90,400 | $308,400 |
| 2022 | $3,698 | $374,600 | $84,900 | $289,700 |
| 2021 | $3,512 | $320,500 | $73,800 | $246,700 |
| 2020 | $4,064 | $296,100 | $70,300 | $225,800 |
| 2019 | $3,648 | $289,600 | $67,000 | $222,600 |
| 2018 | $3,485 | $266,600 | $63,800 | $202,800 |
| 2017 | $3,306 | $249,500 | $60,700 | $188,800 |
| 2016 | $3,440 | $233,200 | $57,800 | $175,400 |
| 2015 | $3,151 | $214,877 | $52,117 | $162,760 |
| 2014 | -- | $201,252 | $50,221 | $151,031 |
| 2013 | -- | $186,537 | $45,430 | $141,107 |
Source: Public Records
Map
Nearby Homes
- 9681 208th St W
- 20829 Iteri Ave
- 20915 Iteri Ave
- 20771 Independence Ave
- 9920 206th St W
- 9965 208th St W
- 21023 Itami Trail
- 9508 211th St W
- 21258 Inspiration Path
- 9485 204th St W
- 21061 Ivory Ln
- 20886 Jenkins Way
- 20724 Hurley Ave
- 20450 Dodd Blvd
- 21220 Ilavista Way
- 21217 Ixonia Ln
- 10200 Upper 205th St W
- 10199 205th Ct W
- 9135 205th St W
- 21316 Idaho Ave
- 20814 Isle Ave
- 20842 Isle Ave
- 20829 Iran Ave
- 20815 Iran Ave
- 20843 Iran Ave
- 20856 Isle Ave
- 20815 Isle Ave
- 20843 Isle Ave
- 20857 Iran Ave
- 9661 208th St W
- 20870 Isle Ave
- 20857 Isle Ave
- 9725 208th St W
- 9643 208th St W
- 20871 Iran Ave
- 20871 Isle Ave
- 20814 Iran Ave
- 20828 Italy Ave
- 9625 208th St W
- 20766 Isle Cir