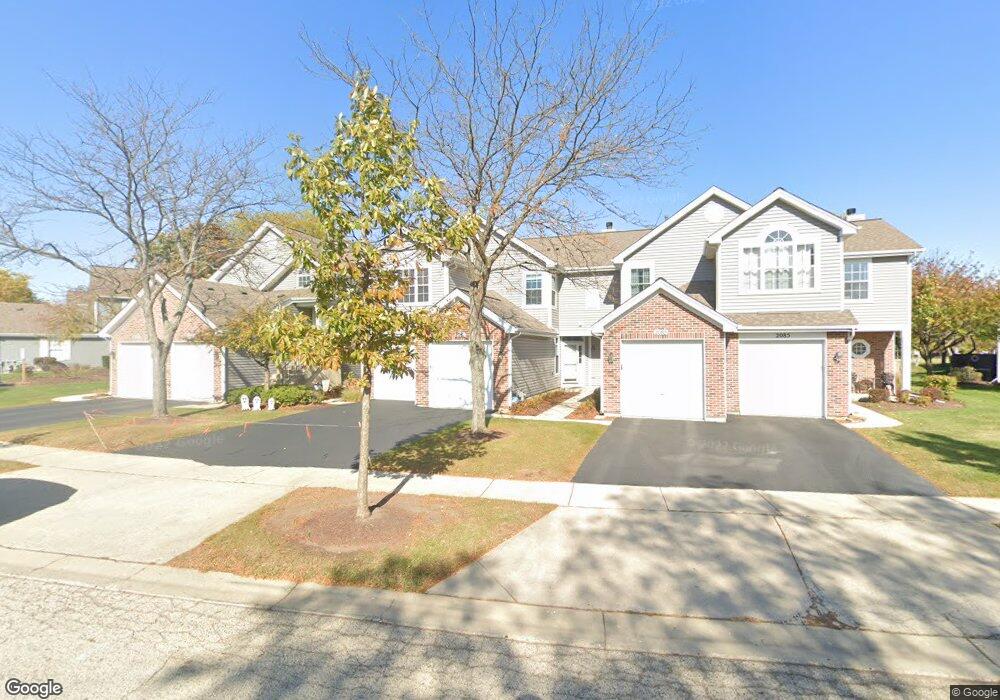
2083 Waverly Ln Unit 4395 Algonquin, IL 60102
Estimated Value: $240,182 - $254,000
2
Beds
--
Bath
1,230
Sq Ft
$200/Sq Ft
Est. Value
About This Home
This home is located at 2083 Waverly Ln Unit 4395, Algonquin, IL 60102 and is currently estimated at $246,546, approximately $200 per square foot. 2083 Waverly Ln Unit 4395 is a home located in Kane County with nearby schools including Westfield Community School, United Junior High School, and Harry D Jacobs High School.
Ownership History
Date
Name
Owned For
Owner Type
Purchase Details
Closed on
Apr 29, 1998
Sold by
Boydston Brent C
Bought by
Madigan Sheila E
Current Estimated Value
Home Financials for this Owner
Home Financials are based on the most recent Mortgage that was taken out on this home.
Original Mortgage
$88,000
Outstanding Balance
$17,315
Interest Rate
7.18%
Estimated Equity
$229,231
Purchase Details
Closed on
Sep 29, 1995
Sold by
Willoughby Farms Townhomes Ltd Prtnrshp
Bought by
Boydston Brent C
Home Financials for this Owner
Home Financials are based on the most recent Mortgage that was taken out on this home.
Original Mortgage
$100,800
Interest Rate
7.68%
Mortgage Type
FHA
Create a Home Valuation Report for This Property
The Home Valuation Report is an in-depth analysis detailing your home's value as well as a comparison with similar homes in the area
Home Values in the Area
Average Home Value in this Area
Purchase History
| Date | Buyer | Sale Price | Title Company |
|---|---|---|---|
| Madigan Sheila E | $106,000 | Greater Illinois Title Compa | |
| Boydston Brent C | $104,000 | Chicago Title Insurance Co |
Source: Public Records
Mortgage History
| Date | Status | Borrower | Loan Amount |
|---|---|---|---|
| Open | Madigan Sheila E | $88,000 | |
| Previous Owner | Boydston Brent C | $100,800 |
Source: Public Records
Tax History Compared to Growth
Tax History
| Year | Tax Paid | Tax Assessment Tax Assessment Total Assessment is a certain percentage of the fair market value that is determined by local assessors to be the total taxable value of land and additions on the property. | Land | Improvement |
|---|---|---|---|---|
| 2024 | $4,446 | $66,482 | $8,371 | $58,111 |
| 2023 | $4,217 | $59,818 | $7,532 | $52,286 |
| 2022 | $3,489 | $47,750 | $7,532 | $40,218 |
| 2021 | $3,370 | $45,086 | $7,112 | $37,974 |
| 2020 | $3,298 | $44,072 | $6,952 | $37,120 |
| 2019 | $3,182 | $41,838 | $6,600 | $35,238 |
| 2018 | $2,987 | $38,399 | $6,469 | $31,930 |
| 2017 | $2,845 | $35,920 | $6,051 | $29,869 |
| 2016 | $2,906 | $34,779 | $5,859 | $28,920 |
| 2015 | -- | $27,760 | $5,490 | $22,270 |
| 2014 | -- | $26,993 | $5,338 | $21,655 |
| 2013 | -- | $32,347 | $5,501 | $26,846 |
Source: Public Records
Map
Nearby Homes
- 30 Arbordale Ct Unit 4284
- 1900 Waverly Ln
- Marianne Plan at Algonquin Meadows - Traditional Townhomes
- Darcy Plan at Algonquin Meadows - Traditional Townhomes
- Charlotte Plan at Algonquin Meadows - Traditional Townhomes
- 2101 Peach Tree Ln Unit 4094
- Adams Plan at Algonquin Meadows - Single Family
- Sequoia Plan at Algonquin Meadows - Single Family
- Bryce Plan at Algonquin Meadows - Single Family
- Rainier Plan at Algonquin Meadows - Single Family
- Santa Rosa Plan at Algonquin Meadows - Single Family
- Biscayne Plan at Algonquin Meadows - Single Family
- 1971 Peach Tree Ln
- Amherst Plan at Algonquin Meadows - Urban Townhomes
- Chatham Plan at Algonquin Meadows - Urban Townhomes
- Chelsea Plan at Algonquin Meadows - Urban Townhomes
- 2043 Peach Tree Ln Unit 4122
- 1090 Glenmont St
- 1247 Glenmont St
- 1255 Glenmont St
- 2081 Waverly Ln Unit 4394
- 2081 Waverly Ln Unit 2081
- 2085 Waverly Ln Unit 4396
- 2075 Waverly Ln Unit 4393
- 2073 Waverly Ln Unit 4392
- 2071 Waverly Ln Unit 4391
- 12 Stonegate Ct Unit 4431
- 4 Stonegate Ct Unit 4435
- 26 Stonegate Ct
- 2061 Waverly Ln Unit 4404
- 2091 Waverly Ln Unit 4381
- 2093 Waverly Ln Unit 4382
- 2105 Waverly Ln Unit 4386
- 2103 Waverly Ln Unit 4385
- 2101 Waverly Ln Unit 4384
- 2095 Waverly Ln Unit 4383
- 28 Stonegate Ct Unit 4441
- 2055 Waverly Ln Unit 4403
- 34 Waverly Ct Unit 4372
- 30 Waverly Ct Unit 4374