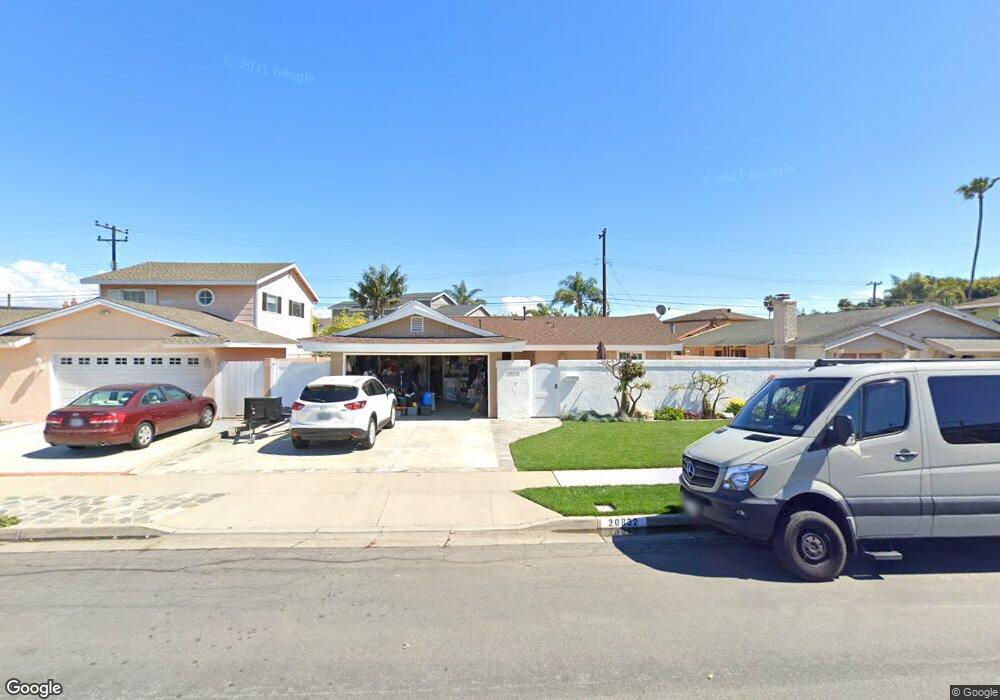
20832 Catamaran Ln Huntington Beach, CA 92646
Southeast NeighborhoodEstimated Value: $1,130,689 - $1,331,000
3
Beds
2
Baths
1,027
Sq Ft
$1,219/Sq Ft
Est. Value
About This Home
This home is located at 20832 Catamaran Ln, Huntington Beach, CA 92646 and is currently estimated at $1,251,422, approximately $1,218 per square foot. 20832 Catamaran Ln is a home located in Orange County with nearby schools including John R. Peterson Elementary, Isaac L. Sowers Middle School, and Edison High School.
Ownership History
Date
Name
Owned For
Owner Type
Purchase Details
Closed on
Aug 25, 2023
Sold by
Dick Lloyd S
Bought by
Lloyd Stephen Dick Revocable Trust and Dick
Current Estimated Value
Purchase Details
Closed on
Sep 10, 2020
Sold by
Pacific Sands Llc
Bought by
Dick Lloyd S
Purchase Details
Closed on
Jun 28, 2010
Sold by
Dick Lloyd S and Lloyd Elsa R
Bought by
Dick Lloyd S
Home Financials for this Owner
Home Financials are based on the most recent Mortgage that was taken out on this home.
Original Mortgage
$375,000
Interest Rate
4.82%
Mortgage Type
New Conventional
Purchase Details
Closed on
Apr 21, 2009
Sold by
Dick Lloyd S and Dick Elsa R
Bought by
Dick Lloyd S and Lloyd Elsa R
Home Financials for this Owner
Home Financials are based on the most recent Mortgage that was taken out on this home.
Original Mortgage
$250,000
Interest Rate
5.02%
Mortgage Type
New Conventional
Purchase Details
Closed on
Oct 6, 1999
Sold by
Dick Lloyd S
Bought by
Dick Lloyd S and Dick Elsa R
Create a Home Valuation Report for This Property
The Home Valuation Report is an in-depth analysis detailing your home's value as well as a comparison with similar homes in the area
Home Values in the Area
Average Home Value in this Area
Purchase History
| Date | Buyer | Sale Price | Title Company |
|---|---|---|---|
| Lloyd Stephen Dick Revocable Trust | -- | None Listed On Document | |
| Dick Lloyd S | -- | None Available | |
| Dick Lloyd S | -- | North American Title Co Inc | |
| Dick Lloyd S | -- | First American Title Company | |
| Dick Lloyd S | -- | -- |
Source: Public Records
Mortgage History
| Date | Status | Borrower | Loan Amount |
|---|---|---|---|
| Previous Owner | Dick Lloyd S | $375,000 | |
| Previous Owner | Dick Lloyd S | $250,000 |
Source: Public Records
Tax History Compared to Growth
Tax History
| Year | Tax Paid | Tax Assessment Tax Assessment Total Assessment is a certain percentage of the fair market value that is determined by local assessors to be the total taxable value of land and additions on the property. | Land | Improvement |
|---|---|---|---|---|
| 2025 | $2,892 | $238,479 | $148,769 | $89,710 |
| 2024 | $2,892 | $233,803 | $145,852 | $87,951 |
| 2023 | $2,823 | $229,219 | $142,992 | $86,227 |
| 2022 | $2,747 | $224,725 | $140,188 | $84,537 |
| 2021 | $2,773 | $220,319 | $137,439 | $82,880 |
| 2020 | $2,754 | $218,060 | $136,029 | $82,031 |
| 2019 | $2,724 | $213,785 | $133,362 | $80,423 |
| 2018 | $2,683 | $209,594 | $130,747 | $78,847 |
| 2017 | $2,647 | $205,485 | $128,184 | $77,301 |
| 2016 | $2,538 | $201,456 | $125,670 | $75,786 |
| 2015 | $2,512 | $198,430 | $123,782 | $74,648 |
| 2014 | $2,460 | $194,544 | $121,358 | $73,186 |
Source: Public Records
Map
Nearby Homes
- 20701 Beach Blvd Unit 103
- 20701 Beach Blvd Unit 65
- 20701 Beach Blvd Unit 100
- 20701 Beach Blvd Unit 107
- 20701 Beach Blvd Unit 298
- 20701 Beach Blvd Unit 128
- 20701 Beach Blvd Unit 200
- 20701 Beach Blvd Unit 30
- 20642 Goshawk Ln
- 613 Frankfort Ave
- 8566 Larkhall Cir Unit 808A
- 8566 Larkhall Cir Unit 809D
- 8565 Larkhall Cir Unit 802C
- 8565 Larkhall Cir Unit 803B
- 20401 Somerville Ln
- 8633 Portola Ct
- 8565 Colusa Cir Unit 906C
- 632 Indianapolis Ave
- 7988 Aldea Cir
- 21254 Lorca Cir Unit 51
- 20842 Catamaran Ln
- 20822 Catamaran Ln
- 8151 Seabird Cir
- 20852 Catamaran Ln
- 20802 Catamaran Ln
- 8152 Seabird Cir
- 20831 Catamaran Ln
- 20841 Catamaran Ln
- 20821 Catamaran Ln
- 20862 Catamaran Ln
- 20792 Catamaran Ln
- 8171 Seabird Cir
- 8152 Mary Cir
- 20851 Catamaran Ln
- 20801 Catamaran Ln
- 8172 Seabird Cir
- 8172 Mary Cir
- 20861 Catamaran Ln
- 20872 Catamaran Ln
- 20782 Catamaran Ln