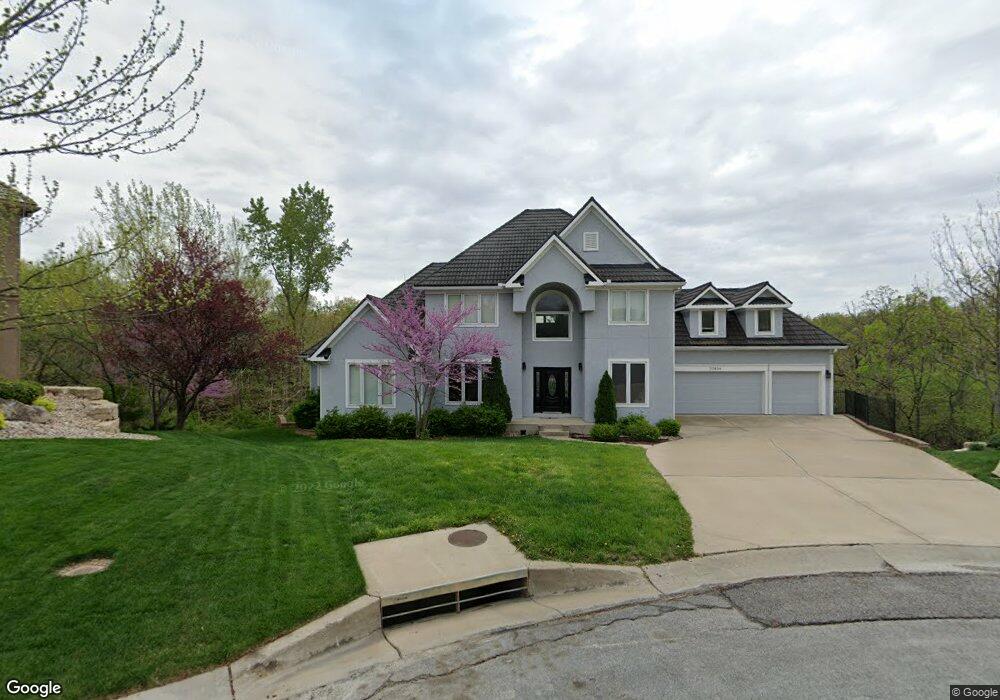
20834 W 92nd St Lenexa, KS 66220
Estimated Value: $679,000 - $728,646
4
Beds
3
Baths
3,012
Sq Ft
$237/Sq Ft
Est. Value
About This Home
This home is located at 20834 W 92nd St, Lenexa, KS 66220 and is currently estimated at $712,412, approximately $236 per square foot. 20834 W 92nd St is a home located in Johnson County with nearby schools including Manchester Park Elementary School, Prairie Trail Middle School, and Olathe Northwest High School.
Ownership History
Date
Name
Owned For
Owner Type
Purchase Details
Closed on
Mar 20, 2025
Sold by
Carney Robert J
Bought by
Robert J Carney Trust and Carney
Current Estimated Value
Purchase Details
Closed on
Apr 30, 2008
Sold by
Bardwell Wendy P
Bought by
Carney Robert John
Purchase Details
Closed on
Feb 3, 2004
Sold by
Us One Construction Inc
Bought by
Carney Robert J
Home Financials for this Owner
Home Financials are based on the most recent Mortgage that was taken out on this home.
Original Mortgage
$400,000
Interest Rate
5.78%
Mortgage Type
Purchase Money Mortgage
Purchase Details
Closed on
Apr 6, 2003
Sold by
Royal Heights Inc
Bought by
U S One Construction Inc
Create a Home Valuation Report for This Property
The Home Valuation Report is an in-depth analysis detailing your home's value as well as a comparison with similar homes in the area
Home Values in the Area
Average Home Value in this Area
Purchase History
| Date | Buyer | Sale Price | Title Company |
|---|---|---|---|
| Robert J Carney Trust | -- | None Listed On Document | |
| Carney Robert John | -- | None Available | |
| Carney Robert J | -- | Security Land Title Company | |
| U S One Construction Inc | -- | Security Land Title Company |
Source: Public Records
Mortgage History
| Date | Status | Borrower | Loan Amount |
|---|---|---|---|
| Previous Owner | Carney Robert J | $400,000 |
Source: Public Records
Tax History Compared to Growth
Tax History
| Year | Tax Paid | Tax Assessment Tax Assessment Total Assessment is a certain percentage of the fair market value that is determined by local assessors to be the total taxable value of land and additions on the property. | Land | Improvement |
|---|---|---|---|---|
| 2024 | $9,185 | $74,601 | $18,246 | $56,355 |
| 2023 | $9,363 | $74,819 | $15,872 | $58,947 |
| 2022 | $8,829 | $68,816 | $15,109 | $53,707 |
| 2021 | $8,485 | $63,032 | $15,109 | $47,923 |
| 2020 | $8,396 | $61,778 | $15,109 | $46,669 |
| 2019 | $7,841 | $57,235 | $10,489 | $46,746 |
| 2018 | $8,405 | $54,349 | $10,489 | $43,860 |
| 2017 | $7,787 | $55,016 | $9,532 | $45,484 |
| 2016 | $8,405 | $53,268 | $9,532 | $43,736 |
| 2015 | $7,341 | $53,061 | $9,530 | $43,531 |
| 2013 | -- | $50,036 | $9,530 | $40,506 |
Source: Public Records
Map
Nearby Homes
- 21359 W 93rd Ct
- 20825 W 94th Terrace
- 9238 Marion St
- 9268 Brownridge St
- 9259 Deer Run St
- 9410 Deer Run St
- 21101 W 90th St
- 9450 Marion St
- 21111 W 95th Terrace
- 21123 W 95th Terrace
- 22068 W 94th Terrace
- 22105 W 94th Terrace
- 22140 W 94th Terrace
- 22092 W 94th Terrace
- 22117 W 94th Terrace
- 22165 W 94th Terrace
- 22116 W 94th Terrace
- 22201 W 94th Terrace
- 22080 W 94th Terrace
- 22129 W 94th Terrace
- 20833 W 92nd St
- 20830 W 92nd St
- 20824 W 92nd St
- 9212 Redbud Ln
- 20817 W 92nd St
- 9208 Redbud Ln
- 9216 Redbud Ln
- 20822 W 92nd St
- 9220 Redbud Ln
- 20809 W 92nd St
- 20818 W 92nd St
- 20814 W 92nd St
- 9224 Redbud Ln
- 9209 Redbud Ln
- 9213 Redbud Ln
- 20829 W 91st Terrace
- 20827 W 91st Terrace
- 20810 W 92nd St
- 9205 Redbud Ln