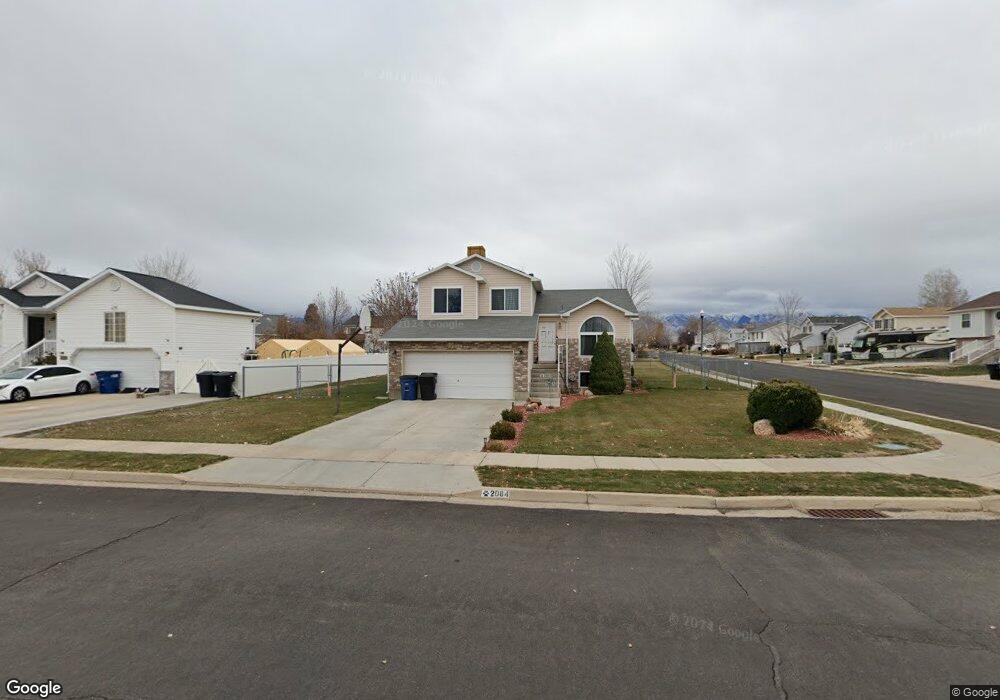
2084 2400 St W Clinton, UT 84015
Estimated Value: $436,000 - $443,000
3
Beds
2
Baths
1,654
Sq Ft
$267/Sq Ft
Est. Value
About This Home
This home is located at 2084 2400 St W, Clinton, UT 84015 and is currently estimated at $440,944, approximately $266 per square foot. 2084 2400 St W is a home located in Davis County with nearby schools including West Clinton Elementary School, West Point Junior High School, and Clearfield High School.
Ownership History
Date
Name
Owned For
Owner Type
Purchase Details
Closed on
Jun 13, 2003
Sold by
Droscher Jake M and Droscher Ashley J
Bought by
Waleske Patricia A and Waleske Deanna S
Current Estimated Value
Home Financials for this Owner
Home Financials are based on the most recent Mortgage that was taken out on this home.
Original Mortgage
$105,600
Outstanding Balance
$45,026
Interest Rate
5.53%
Mortgage Type
Purchase Money Mortgage
Estimated Equity
$395,918
Purchase Details
Closed on
Jan 14, 2000
Sold by
Butler Timothy W
Bought by
Droscher Jake M and Droscher Ashley J
Home Financials for this Owner
Home Financials are based on the most recent Mortgage that was taken out on this home.
Original Mortgage
$123,434
Interest Rate
7.83%
Mortgage Type
FHA
Create a Home Valuation Report for This Property
The Home Valuation Report is an in-depth analysis detailing your home's value as well as a comparison with similar homes in the area
Home Values in the Area
Average Home Value in this Area
Purchase History
| Date | Buyer | Sale Price | Title Company |
|---|---|---|---|
| Waleske Patricia A | -- | Heritage West Title Insuranc | |
| Droscher Jake M | -- | Bonneville Title Company Inc |
Source: Public Records
Mortgage History
| Date | Status | Borrower | Loan Amount |
|---|---|---|---|
| Open | Waleske Patricia A | $105,600 | |
| Previous Owner | Droscher Jake M | $123,434 | |
| Closed | Waleske Patricia A | $26,400 |
Source: Public Records
Tax History Compared to Growth
Tax History
| Year | Tax Paid | Tax Assessment Tax Assessment Total Assessment is a certain percentage of the fair market value that is determined by local assessors to be the total taxable value of land and additions on the property. | Land | Improvement |
|---|---|---|---|---|
| 2025 | $2,282 | $219,450 | $89,121 | $130,329 |
| 2024 | $2,191 | $211,751 | $97,620 | $114,131 |
| 2023 | $2,097 | $375,000 | $111,669 | $263,331 |
| 2022 | $2,263 | $223,850 | $67,574 | $156,276 |
| 2021 | $2,064 | $303,000 | $85,838 | $217,162 |
| 2020 | $1,790 | $260,000 | $73,604 | $186,396 |
| 2019 | $1,727 | $245,000 | $84,781 | $160,219 |
| 2018 | $1,564 | $218,000 | $71,450 | $146,550 |
| 2016 | $1,310 | $94,270 | $27,961 | $66,309 |
| 2015 | $1,285 | $87,945 | $27,961 | $59,984 |
| 2014 | $1,324 | $92,092 | $27,961 | $64,131 |
| 2013 | -- | $89,348 | $27,143 | $62,205 |
Source: Public Records
Map
Nearby Homes
- Harvard Plan at Summerfield - Enclave
- 2208 W 2615 N
- Linden Plan at Summerfield - Vista
- Yale Plan at Summerfield - Enclave
- Gambel Oak Plan at Summerfield - Vista
- Cedar Plan at Summerfield - Vista
- Elm Plan at Summerfield - Vista
- Princeton Plan at Summerfield - Enclave
- Cambridge Plan at Summerfield - Enclave
- Cornell Plan at Summerfield - Enclave
- Sycamore Plan at Summerfield - Vista
- Berkeley Plan at Summerfield - Enclave
- Birch Plan at Summerfield - Vista
- Stanford Plan at Summerfield - Enclave
- 2219 N 2475 W
- 2434 W 2250 N
- 2162 N 2290 W
- 2617 N 2080 W Unit 176
- 2322 N 2500 W
- 2616 N 2125 W Unit 147