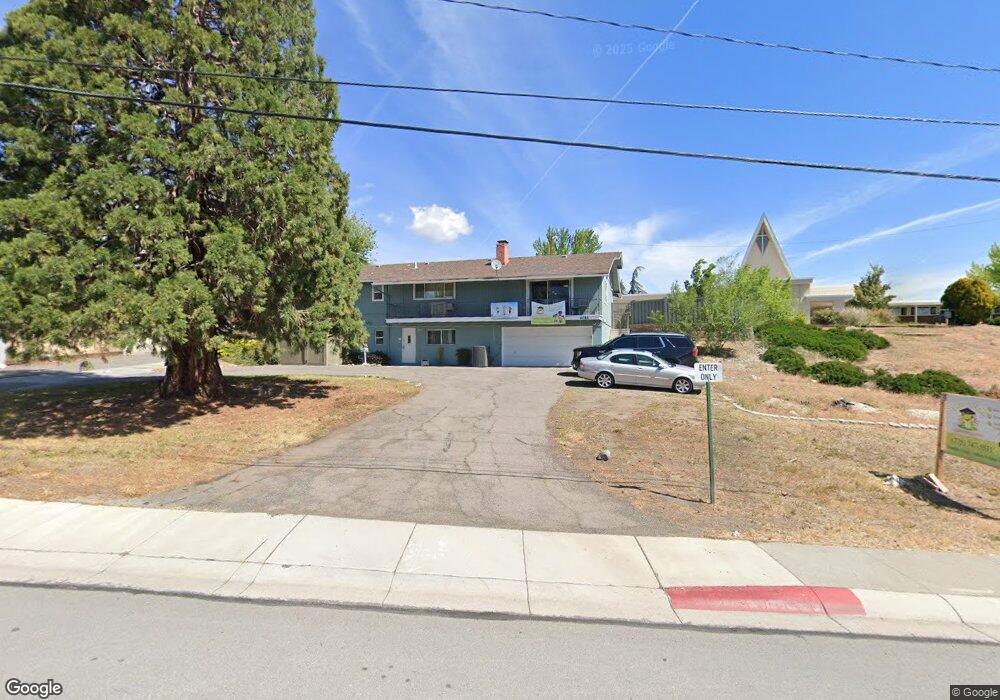
2085 W 7th St Reno, NV 89503
Kings Row NeighborhoodEstimated Value: $609,103
4
Beds
2
Baths
1,814
Sq Ft
$336/Sq Ft
Est. Value
About This Home
This home is located at 2085 W 7th St, Reno, NV 89503 and is currently estimated at $609,103, approximately $335 per square foot. 2085 W 7th St is a home located in Washoe County with nearby schools including Elmcrest Elementary School, Archie Clayton Pre-AP Academy, and Robert McQueen High School.
Ownership History
Date
Name
Owned For
Owner Type
Purchase Details
Closed on
May 21, 2007
Sold by
Faith Lutheran Church 9 Nevada Religious
Bought by
Blank Virginia M and Blank Robert R
Current Estimated Value
Home Financials for this Owner
Home Financials are based on the most recent Mortgage that was taken out on this home.
Original Mortgage
$492,300
Interest Rate
6.18%
Mortgage Type
Construction
Create a Home Valuation Report for This Property
The Home Valuation Report is an in-depth analysis detailing your home's value as well as a comparison with similar homes in the area
Home Values in the Area
Average Home Value in this Area
Purchase History
| Date | Buyer | Sale Price | Title Company |
|---|---|---|---|
| Blank Virginia M | $342,500 | First Centennial Title Co |
Source: Public Records
Mortgage History
| Date | Status | Borrower | Loan Amount |
|---|---|---|---|
| Previous Owner | Blank Virginia M | $492,300 |
Source: Public Records
Tax History Compared to Growth
Tax History
| Year | Tax Paid | Tax Assessment Tax Assessment Total Assessment is a certain percentage of the fair market value that is determined by local assessors to be the total taxable value of land and additions on the property. | Land | Improvement |
|---|---|---|---|---|
| 2025 | $2,991 | $98,569 | $51,048 | $47,521 |
| 2024 | $2,991 | $96,121 | $47,267 | $48,854 |
| 2023 | $2,769 | $84,649 | $37,813 | $46,836 |
| 2022 | $2,563 | $69,859 | $30,251 | $39,608 |
| 2021 | $2,519 | $68,420 | $28,360 | $40,060 |
| 2020 | $2,548 | $69,223 | $28,360 | $40,863 |
| 2019 | $2,435 | $66,314 | $26,334 | $39,980 |
| 2018 | $2,423 | $66,020 | $26,334 | $39,686 |
| 2017 | $2,453 | $66,563 | $26,334 | $40,229 |
| 2016 | $2,495 | $67,710 | $26,334 | $41,376 |
| 2015 | $2,530 | $68,655 | $26,334 | $42,321 |
| 2014 | $2,489 | $67,636 | $26,334 | $41,302 |
| 2013 | -- | $67,481 | $26,334 | $41,147 |
Source: Public Records
Map
Nearby Homes