20851 W Torrey Pines Ln Plainfield, IL 60544
Carillon NeighborhoodEstimated Value: $313,000 - $363,000
--
Bed
--
Bath
--
Sq Ft
6,098
Sq Ft Lot
About This Home
This home is located at 20851 W Torrey Pines Ln, Plainfield, IL 60544 and is currently estimated at $338,864. 20851 W Torrey Pines Ln is a home located in Will County with nearby schools including Skoff Elementary School, A. Vito Martinez Middle School, and Romeoville High School.
Ownership History
Date
Name
Owned For
Owner Type
Purchase Details
Closed on
Aug 10, 2018
Sold by
Fitzgerald Michael J and Fitzgerald Betty J
Bought by
Fitzgerald Michael J and Fitzgerald Betty J
Current Estimated Value
Purchase Details
Closed on
Jun 7, 2002
Sold by
Tiemann Clifford H and Tiemann Melba R
Bought by
Fitzgerald Michael J and Fitzgerald Betty J
Home Financials for this Owner
Home Financials are based on the most recent Mortgage that was taken out on this home.
Original Mortgage
$176,000
Outstanding Balance
$74,732
Interest Rate
6.87%
Estimated Equity
$264,132
Purchase Details
Closed on
Jan 20, 1997
Sold by
The Northern Trust Company
Bought by
Tiemann Clifford H and Tiemann Melba R
Home Financials for this Owner
Home Financials are based on the most recent Mortgage that was taken out on this home.
Original Mortgage
$100,000
Interest Rate
7.74%
Create a Home Valuation Report for This Property
The Home Valuation Report is an in-depth analysis detailing your home's value as well as a comparison with similar homes in the area
Home Values in the Area
Average Home Value in this Area
Purchase History
| Date | Buyer | Sale Price | Title Company |
|---|---|---|---|
| Fitzgerald Michael J | -- | None Available | |
| Fitzgerald Michael J | $220,000 | -- | |
| Tiemann Clifford H | $161,500 | Chicago Title Insurance Co |
Source: Public Records
Mortgage History
| Date | Status | Borrower | Loan Amount |
|---|---|---|---|
| Open | Fitzgerald Michael J | $176,000 | |
| Previous Owner | Tiemann Clifford H | $100,000 |
Source: Public Records
Tax History Compared to Growth
Tax History
| Year | Tax Paid | Tax Assessment Tax Assessment Total Assessment is a certain percentage of the fair market value that is determined by local assessors to be the total taxable value of land and additions on the property. | Land | Improvement |
|---|---|---|---|---|
| 2024 | $8,321 | $105,750 | $23,113 | $82,637 |
| 2023 | $8,321 | $94,937 | $20,750 | $74,187 |
| 2022 | $7,792 | $89,435 | $19,548 | $69,887 |
| 2021 | $7,120 | $84,047 | $18,370 | $65,677 |
| 2020 | $7,187 | $81,283 | $17,766 | $63,517 |
| 2019 | $6,783 | $77,046 | $16,840 | $60,206 |
| 2018 | $6,347 | $71,946 | $15,725 | $56,221 |
| 2017 | $5,942 | $67,919 | $14,845 | $53,074 |
| 2016 | $6,111 | $63,654 | $13,913 | $49,741 |
| 2015 | $5,288 | $58,801 | $12,852 | $45,949 |
| 2014 | $5,288 | $55,473 | $12,125 | $43,348 |
| 2013 | $5,288 | $55,473 | $12,125 | $43,348 |
Source: Public Records
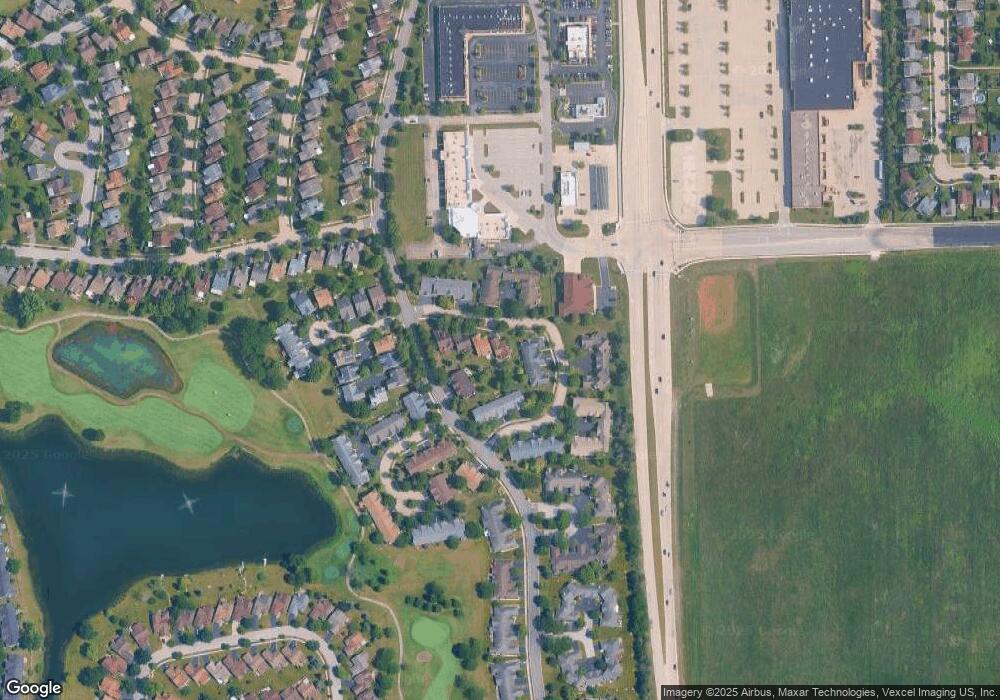
Map
Nearby Homes
- 20862 W Torrey Pines Ln Unit 1B
- 20862 W Torrey Pines Ln Unit 2B
- 21019 W Torrey Pines Ct
- 21144 Buckeye Ct
- 13494 Redberry Cir
- 13453 Tall Pines Ln
- 13404 Tall Pines Ln
- 21008 W Hazelnut Ln
- 13810 S Magnolia Dr
- 21024 W Walnut Dr
- 420 N Maggie Ln
- 13869 S Mandarin Ct
- 20928 W Spruce Ln
- 20816 W Forsythia Ct
- 20965 W Snowberry Ln
- 1228 Le Moyne Ave
- 13232 S Bayberry Ln
- 440 N Kelly Ct
- 20817 W Chinaberry Ct
- 20944 W Blossom Ln
- 20855 W Torrey Pines Ln
- 20827 W Torrey Pines
- 20823 W Torrey Pines Ln
- 20819 W Torrey Pines Ln
- 20815 W Torrey Pines Ln
- 13511 S Magnolia Dr
- 20834 W Torrey Pines Ln
- 20757 W Torrey Pines Ln
- 20854 W Torrey Pines Ln
- 13513 S Magnolia Dr
- 20755 W Torrey Pines Ln
- 20753 W Torrey Pines Ln
- 20863 W Torrey Pines
- 20863 W Torrey Pines Ln
- 20850 W Torrey Pines Ln
- 20838 W Torrey Pines Ln
- 20751 W Torrey Pines Ln
- 20751 W Torrey Pines Ln Unit D
- 20858 W Torrey Pines Ln Unit B