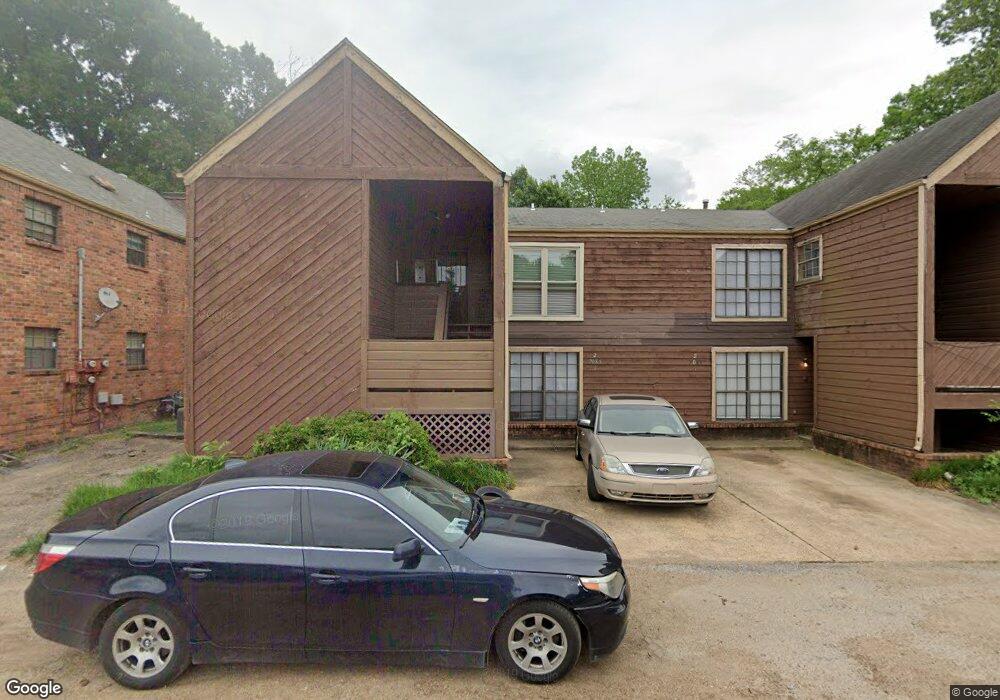
2086 Crestway Dr Unit 2 Memphis, TN 38134
Estimated Value: $52,000 - $121,000
2
Beds
2
Baths
1,265
Sq Ft
$60/Sq Ft
Est. Value
About This Home
This home is located at 2086 Crestway Dr Unit 2, Memphis, TN 38134 and is currently estimated at $75,763, approximately $59 per square foot. 2086 Crestway Dr Unit 2 is a home located in Shelby County with nearby schools including Shelby Oaks Elementary School, Kate Bond Middle School, and Kingsbury High School.
Ownership History
Date
Name
Owned For
Owner Type
Purchase Details
Closed on
Sep 11, 2009
Sold by
Hamm Corinne Jewel
Bought by
Jones Danielle L and Jones Hazel E
Current Estimated Value
Purchase Details
Closed on
Jun 28, 2001
Sold by
Jones Kathryn Rhea
Bought by
Hamm Corinne Jewel
Home Financials for this Owner
Home Financials are based on the most recent Mortgage that was taken out on this home.
Original Mortgage
$44,900
Interest Rate
7.17%
Mortgage Type
FHA
Purchase Details
Closed on
Jun 12, 1997
Sold by
Bankers Trust Company Of California Na
Bought by
Jones Kathryn Rhea
Home Financials for this Owner
Home Financials are based on the most recent Mortgage that was taken out on this home.
Original Mortgage
$42,382
Interest Rate
7.97%
Mortgage Type
FHA
Purchase Details
Closed on
Jan 10, 1997
Sold by
Weiss Arnold M
Bought by
Bankers Trust Company Of California Na and Vendee Mtg Trust 1993-1
Create a Home Valuation Report for This Property
The Home Valuation Report is an in-depth analysis detailing your home's value as well as a comparison with similar homes in the area
Home Values in the Area
Average Home Value in this Area
Purchase History
| Date | Buyer | Sale Price | Title Company |
|---|---|---|---|
| Jones Danielle L | $40,900 | Saddle Creek Title Llc | |
| Hamm Corinne Jewel | $45,500 | -- | |
| Jones Kathryn Rhea | $41,900 | -- | |
| Bankers Trust Company Of California Na | $36,672 | -- |
Source: Public Records
Mortgage History
| Date | Status | Borrower | Loan Amount |
|---|---|---|---|
| Previous Owner | Hamm Corinne Jewel | $44,900 | |
| Previous Owner | Jones Kathryn Rhea | $42,382 | |
| Closed | Jones Kathryn Rhea | $2,657 |
Source: Public Records
Tax History Compared to Growth
Tax History
| Year | Tax Paid | Tax Assessment Tax Assessment Total Assessment is a certain percentage of the fair market value that is determined by local assessors to be the total taxable value of land and additions on the property. | Land | Improvement |
|---|---|---|---|---|
| 2025 | -- | $10,325 | $475 | $9,850 |
| 2024 | $194 | $5,725 | $475 | $5,250 |
| 2023 | $349 | $5,725 | $475 | $5,250 |
| 2022 | $349 | $5,725 | $475 | $5,250 |
| 2021 | $353 | $5,725 | $475 | $5,250 |
| 2020 | $324 | $4,475 | $475 | $4,000 |
| 2019 | $324 | $4,475 | $475 | $4,000 |
| 2018 | $324 | $4,475 | $475 | $4,000 |
| 2017 | $184 | $4,475 | $475 | $4,000 |
| 2016 | $310 | $7,100 | $0 | $0 |
| 2014 | $310 | $7,100 | $0 | $0 |
Source: Public Records
Map
Nearby Homes
- 6321 Ashton Rd
- 0 Summer Ave Unit 10200827
- 0 Summer Ave Unit 10195870
- 0 Summer Ave Unit 10195869
- 6014 Raleigh Lagrange Rd
- 2233 Woodfield Park Rd
- 2205 Oldfield Dr
- 2180 Henrietta Rd
- 2331 Eveningview Dr
- 2426 Lacosta Dr
- 5981 Diplomat Place
- 2058 Olive Bark Cove
- 2050 Olive Bark Cove
- 5744 N Lake Oaks Dr
- 2392 Gardenbrook Dr
- 6085 Ivanhoe Rd
- 5577 Falling Bark Dr
- 5616 Falling Bark Dr
- 2623 Surrey Wood Dr
- 6016 Ivawood Dr
- 2086 Crestway Dr Unit 1
- 2086 Crestway Dr Unit 61
- 2086 Crestway Dr Unit 62B
- 2086 Crestway Dr
- 2084 Crestway Dr Unit 63A
- 2084 Crestway Dr Unit 64B
- 2094 Crestway Dr Unit 67A
- 2094 Crestway Dr
- 2094 Crestway Dr Unit 68
- 2076 Crestway Dr Unit 57A
- 2076 Crestway Dr
- 2096 Crestway Dr Unit 2
- 2096 Crestway Dr
- 2096 Crestway Dr Unit 66B
- 6225 Ashton Rd Unit 6225A
- 6225 Ashton Rd Unit 55A
- 6225 Ashton Rd
- 2074 Crestway Dr Unit 2
- 2074 Crestway Dr Unit 59A
- 2074 Crestway Dr