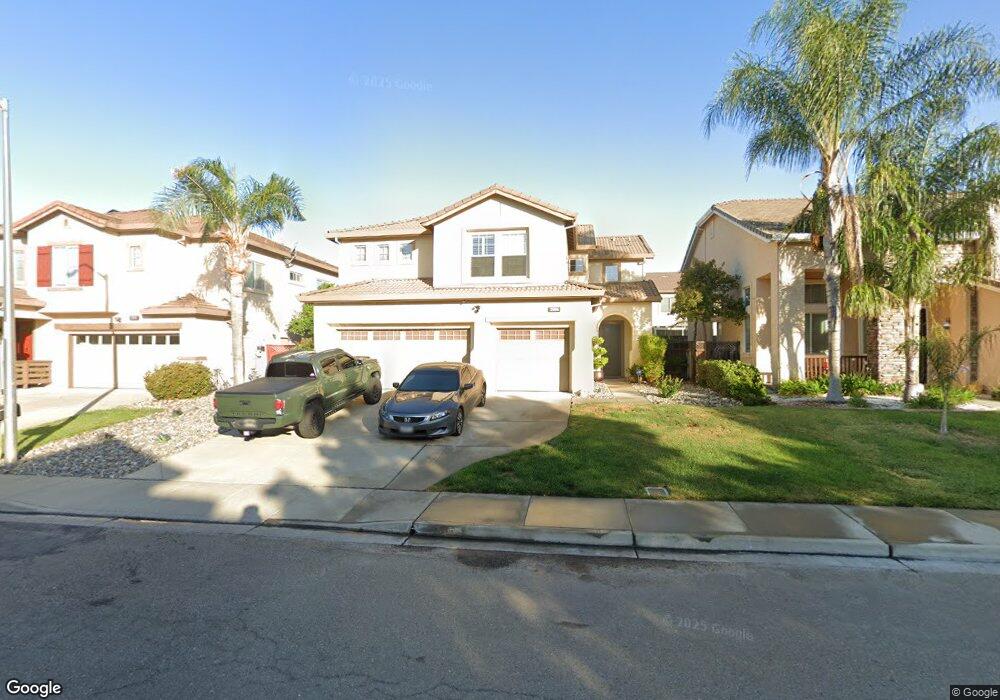
2086 Redbud Way Antioch, CA 94509
Deer Valley NeighborhoodEstimated Value: $676,704 - $781,000
4
Beds
3
Baths
2,590
Sq Ft
$277/Sq Ft
Est. Value
About This Home
This home is located at 2086 Redbud Way, Antioch, CA 94509 and is currently estimated at $716,926, approximately $276 per square foot. 2086 Redbud Way is a home located in Contra Costa County with nearby schools including John Muir Elementary School, Dallas Ranch Middle School, and Deer Valley High School.
Ownership History
Date
Name
Owned For
Owner Type
Purchase Details
Closed on
Dec 15, 2006
Sold by
Abenoja Marie J and Abenoja Edwin
Bought by
Abenoja Edwin and Abenoja Marie J
Current Estimated Value
Home Financials for this Owner
Home Financials are based on the most recent Mortgage that was taken out on this home.
Original Mortgage
$80,000
Interest Rate
6.33%
Mortgage Type
Stand Alone Refi Refinance Of Original Loan
Purchase Details
Closed on
May 4, 2006
Sold by
Abenoja Edwin and Abenoja Marie J
Bought by
Abenoja Edwin and Abenoja Marie J
Home Financials for this Owner
Home Financials are based on the most recent Mortgage that was taken out on this home.
Original Mortgage
$504,000
Outstanding Balance
$285,410
Interest Rate
6.3%
Mortgage Type
Stand Alone Refi Refinance Of Original Loan
Estimated Equity
$431,516
Purchase Details
Closed on
Oct 24, 2000
Sold by
Davidon Homes
Bought by
Abenoja Edwin and Abenoja Marie J
Home Financials for this Owner
Home Financials are based on the most recent Mortgage that was taken out on this home.
Original Mortgage
$244,300
Interest Rate
7.89%
Mortgage Type
Purchase Money Mortgage
Create a Home Valuation Report for This Property
The Home Valuation Report is an in-depth analysis detailing your home's value as well as a comparison with similar homes in the area
Home Values in the Area
Average Home Value in this Area
Purchase History
| Date | Buyer | Sale Price | Title Company |
|---|---|---|---|
| Abenoja Edwin | -- | Alliance Title Company | |
| Abenoja Edwin | -- | Alliance Title Company | |
| Abenoja Edwin | $305,500 | First American Title Guarant |
Source: Public Records
Mortgage History
| Date | Status | Borrower | Loan Amount |
|---|---|---|---|
| Closed | Abenoja Edwin | $80,000 | |
| Open | Abenoja Edwin | $504,000 | |
| Closed | Abenoja Edwin | $244,300 | |
| Closed | Abenoja Edwin | $15,250 |
Source: Public Records
Tax History
| Year | Tax Paid | Tax Assessment Tax Assessment Total Assessment is a certain percentage of the fair market value that is determined by local assessors to be the total taxable value of land and additions on the property. | Land | Improvement |
|---|---|---|---|---|
| 2025 | $5,577 | $473,127 | $66,286 | $406,841 |
| 2024 | $5,250 | $463,851 | $64,987 | $398,864 |
| 2023 | $5,250 | $454,757 | $63,713 | $391,044 |
| 2022 | $5,168 | $445,841 | $62,464 | $383,377 |
| 2021 | $5,013 | $437,100 | $61,240 | $375,860 |
| 2019 | $4,901 | $424,138 | $59,425 | $364,713 |
| 2018 | $4,716 | $415,822 | $58,260 | $357,562 |
| 2017 | $4,619 | $407,669 | $57,118 | $350,551 |
| 2016 | $4,461 | $395,000 | $55,344 | $339,656 |
| 2015 | $4,327 | $347,500 | $48,689 | $298,811 |
| 2014 | $4,936 | $320,500 | $44,906 | $275,594 |
Source: Public Records
Map
Nearby Homes
- 2076 Catalpa Way
- 2096 Goldpine Way
- 2133 Bamboo Way
- 1736 Nandina Ct
- 4528 Fallow Way
- 4529 Pronghorn Way
- 4836 Belford Peak Way
- 2057 Crater Peak Way
- 1928 Badger Pass Way
- 2117 Mark Twain Dr
- 425 Sandy Hill Ct
- 4729 Matterhorn Ct
- 1879 Mount Conness Way
- 318 Redrock Dr
- 4722 Cache Peak Dr
- 4737 Crestone Peak Ct
- 4100 Diorite Ct
- 1157 Rockspring Way
- 941 Bluerock Dr
- 4125 Rogers Canyon Rd
- 2082 Redbud Way
- 2090 Redbud Way
- 2078 Redbud Way
- 2094 Redbud Way
- 2085 Catalpa Way
- 2089 Catalpa Way
- 2081 Catalpa Way
- 2093 Catalpa Way
- 2077 Catalpa Way
- 2087 Redbud Way
- 2098 Redbud Way
- 2083 Redbud Way
- 2074 Redbud Way
- 2091 Redbud Way
- 2079 Redbud Way
- 2073 Catalpa Way
- 2097 Catalpa Way
- 2095 Redbud Way
- 2070 Redbud Way
- 2075 Redbud Way
Your Personal Tour Guide
Ask me questions while you tour the home.