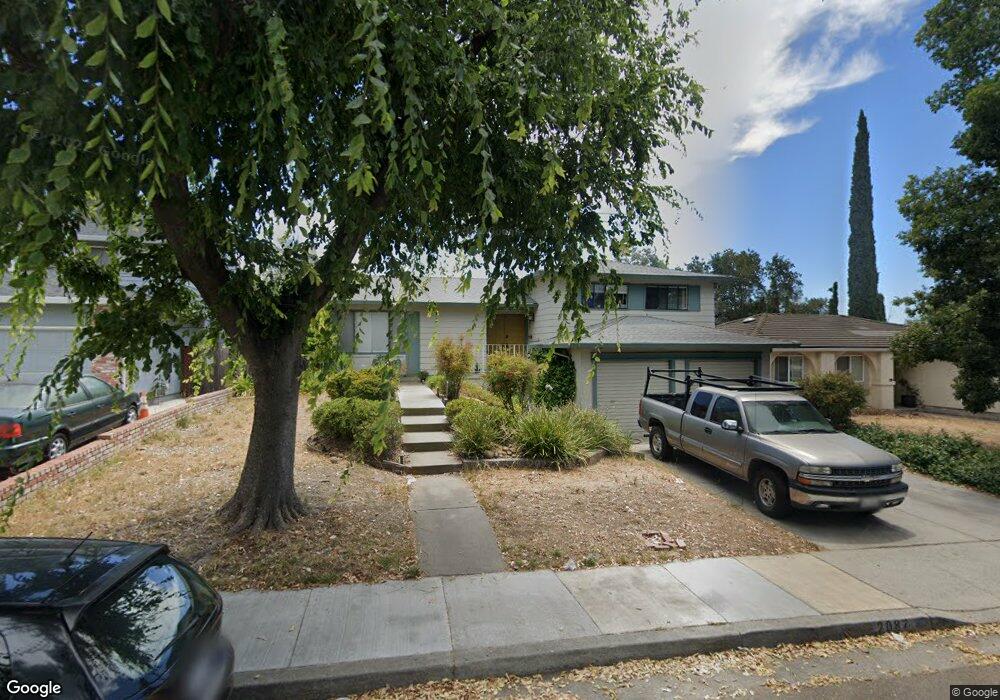
2087 Flintcrest Dr San Jose, CA 95148
Mount Pleasant NeighborhoodEstimated Value: $1,209,000 - $1,331,000
3
Beds
3
Baths
1,899
Sq Ft
$671/Sq Ft
Est. Value
About This Home
This home is located at 2087 Flintcrest Dr, San Jose, CA 95148 and is currently estimated at $1,275,108, approximately $671 per square foot. 2087 Flintcrest Dr is a home located in Santa Clara County with nearby schools including Mt. Pleasant High School, Adelante Dual Language Academy, and Ida Jew Academies.
Ownership History
Date
Name
Owned For
Owner Type
Purchase Details
Closed on
Nov 28, 2023
Sold by
Dimayuga Sarah S and Dimayuga Alan B
Bought by
Dimayuga Revocable Trust and Dimayuga
Current Estimated Value
Create a Home Valuation Report for This Property
The Home Valuation Report is an in-depth analysis detailing your home's value as well as a comparison with similar homes in the area
Home Values in the Area
Average Home Value in this Area
Purchase History
| Date | Buyer | Sale Price | Title Company |
|---|---|---|---|
| Dimayuga Revocable Trust | -- | None Listed On Document | |
| Dimayuga Sarah S | -- | None Listed On Document |
Source: Public Records
Tax History
| Year | Tax Paid | Tax Assessment Tax Assessment Total Assessment is a certain percentage of the fair market value that is determined by local assessors to be the total taxable value of land and additions on the property. | Land | Improvement |
|---|---|---|---|---|
| 2025 | $5,002 | $222,560 | $59,840 | $162,720 |
| 2024 | $5,002 | $218,197 | $58,667 | $159,530 |
| 2023 | $4,809 | $213,919 | $57,517 | $156,402 |
| 2022 | $4,747 | $209,726 | $56,390 | $153,336 |
| 2021 | $4,107 | $205,615 | $55,285 | $150,330 |
| 2020 | $4,395 | $203,508 | $54,719 | $148,789 |
| 2019 | $4,244 | $199,519 | $53,647 | $145,872 |
| 2018 | $4,118 | $195,608 | $52,596 | $143,012 |
| 2017 | $4,050 | $191,773 | $51,565 | $140,208 |
| 2016 | $3,526 | $188,013 | $50,554 | $137,459 |
| 2015 | $3,510 | $185,190 | $49,795 | $135,395 |
| 2014 | $3,064 | $181,563 | $48,820 | $132,743 |
Source: Public Records
Map
Nearby Homes
- 2030 Flintbury Ct
- 3165 Coldwater Dr
- 3455 Cuesta Dr
- 3410 Gila Dr
- 3248 Rocky Mountain Dr
- 3485 Rubion Ct
- 2275 Astrahan Ln
- 2571 Gumdrop Dr
- 3282 Mount Everest Dr
- 1710 Alder Creek Ct
- 3623 Westview Dr
- 2363 Pleasant Acres Dr
- 1542 Harvest Dr
- 3633 Westview Dr
- 3381 Mount Everest Dr
- 1572 Amesbury Way
- 3515 Pine Ridge Way
- 2409 Klein Rd
- 2808 Quest Ct
- 1776 Home Gate Dr
- 2083 Flintcrest Dr
- 2091 Flintcrest Dr
- 2079 Flintcrest Dr
- 2095 Flintcrest Dr
- 2045 Hayworth Dr
- 2048 Flintbury Ct
- 2075 Flintcrest Dr
- 2099 Flintcrest Dr
- 2041 Hayworth Dr
- 2050 Hayworth Dr
- 2042 Flintbury Ct
- 2046 Hayworth Dr
- 2071 Flintcrest Dr
- 2037 Hayworth Dr
- 3250 Flintmont Dr
- 2036 Flintbury Ct
- 2072 Flintcrest Dr
- 2042 Hayworth Dr
- 3242 Flintmont Dr
- 2067 Flintcrest Dr
Your Personal Tour Guide
Ask me questions while you tour the home.