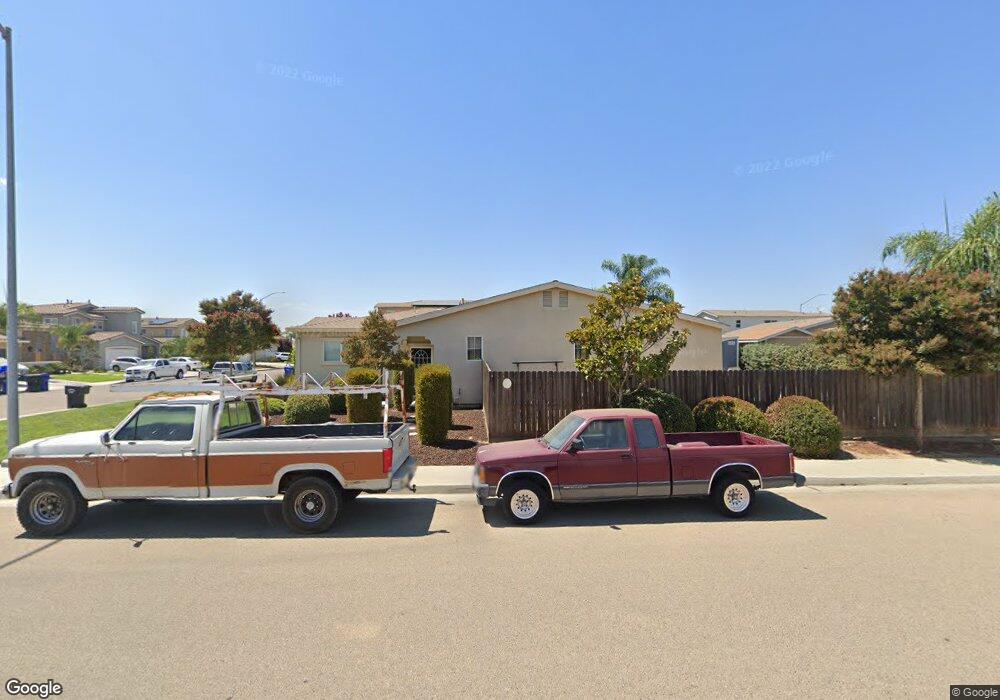
2087 Waldo Way Dinuba, CA 93618
Estimated Value: $355,593 - $402,000
4
Beds
3
Baths
1,638
Sq Ft
$234/Sq Ft
Est. Value
About This Home
This home is located at 2087 Waldo Way, Dinuba, CA 93618 and is currently estimated at $383,398, approximately $234 per square foot. 2087 Waldo Way is a home located in Tulare County with nearby schools including Jefferson Elementary School, Washington Intermediate School, and Dinuba High School.
Ownership History
Date
Name
Owned For
Owner Type
Purchase Details
Closed on
Sep 30, 2024
Sold by
Saucedo Erika I Velasquez and Avila Raymundo
Bought by
Avila Raymundo
Current Estimated Value
Home Financials for this Owner
Home Financials are based on the most recent Mortgage that was taken out on this home.
Original Mortgage
$240,000
Outstanding Balance
$237,529
Interest Rate
6.46%
Mortgage Type
New Conventional
Estimated Equity
$145,869
Purchase Details
Closed on
Apr 1, 2024
Sold by
Avila Rogelio
Bought by
Saucedo Erika I Velasquez and Avila Raymundo
Purchase Details
Closed on
Mar 22, 2024
Sold by
Avila Rogelio
Bought by
Saucedo Erika I Velasquez and Avila Raymundo
Purchase Details
Closed on
Jun 11, 2009
Sold by
K Hovnanian Forecast Homes Northern Inc
Bought by
Avila Raymundo and Avila Rogelio
Home Financials for this Owner
Home Financials are based on the most recent Mortgage that was taken out on this home.
Original Mortgage
$167,650
Interest Rate
4.76%
Mortgage Type
FHA
Create a Home Valuation Report for This Property
The Home Valuation Report is an in-depth analysis detailing your home's value as well as a comparison with similar homes in the area
Home Values in the Area
Average Home Value in this Area
Purchase History
| Date | Buyer | Sale Price | Title Company |
|---|---|---|---|
| Avila Raymundo | -- | None Listed On Document | |
| Saucedo Erika I Velasquez | -- | None Listed On Document | |
| Saucedo Erika I Velasquez | -- | None Listed On Document | |
| Avila Raymundo | $171,000 | None Available |
Source: Public Records
Mortgage History
| Date | Status | Borrower | Loan Amount |
|---|---|---|---|
| Open | Avila Raymundo | $240,000 | |
| Previous Owner | Avila Raymundo | $167,650 |
Source: Public Records
Tax History Compared to Growth
Tax History
| Year | Tax Paid | Tax Assessment Tax Assessment Total Assessment is a certain percentage of the fair market value that is determined by local assessors to be the total taxable value of land and additions on the property. | Land | Improvement |
|---|---|---|---|---|
| 2025 | $2,517 | $283,373 | $58,235 | $225,138 |
| 2024 | $2,517 | $215,638 | $44,189 | $171,449 |
| 2023 | $2,491 | $211,411 | $43,323 | $168,088 |
| 2022 | $2,382 | $207,267 | $42,474 | $164,793 |
| 2021 | $2,327 | $203,203 | $41,641 | $161,562 |
| 2020 | $2,362 | $201,119 | $41,214 | $159,905 |
| 2019 | $2,391 | $197,176 | $40,406 | $156,770 |
| 2018 | $2,316 | $193,310 | $39,614 | $153,696 |
| 2017 | $2,300 | $189,519 | $38,837 | $150,682 |
| 2016 | $2,200 | $185,802 | $38,075 | $147,727 |
Source: Public Records
Map
Nearby Homes
- 2029 Golden Way
- 1981 Dunbar Way
- 215 S Gloria Ave
- 2770 E El Monte Way
- 42220 Road 92
- 65745 Big Meadows Rd
- 315 S P St
- 223 N H St
- 581 N Crawford Ave Unit 136
- 581 N Crawford Ave Unit 46
- 581 N Crawford Ave Unit 112
- 581 N Crawford Ave Unit 94
- 225 W Tulare St
- 0 S Alta Ave
- 333 N L St
- 0 N Hayes Ave
- Savannah Plan at Empire Ranch
- Charlotte Plan at Empire Ranch
- Raleigh Plan at Empire Ranch
- Lexington Plan at Empire Ranch
- 2059 Waldo Way
- 2088 Golden Way
- 2056 Golden Way
- 2021 Waldo Way
- 2092 Waldo Way
- 2020 Golden Way
- 2060 Waldo Way
- 2005 Waldo Way
- 2022 Waldo Way
- 2002 Golden Way
- 2010 Waldo Way
- 1973 Waldo Way
- 2089 Golden Way
- 2089 Roosevelt Way
- 2089 Golden Way
- 2063 Golden Way
- 2053 Roosevelt Way
- 1978 Golden Way
- 2025 Roosevelt Way
- 1974 Waldo Way