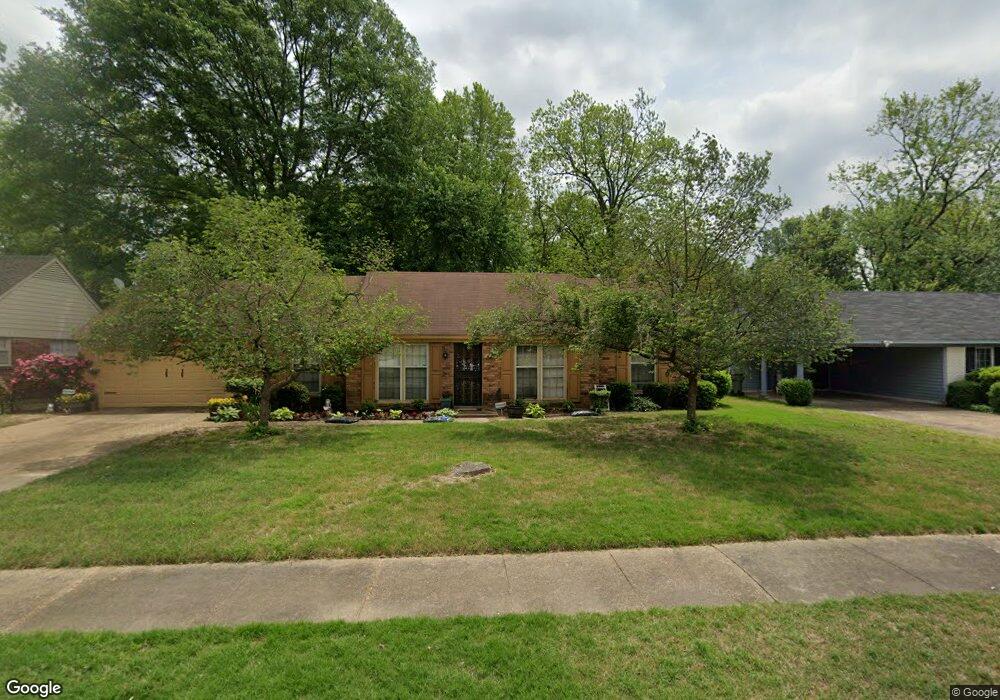
2088 Hampton Hill Dr Memphis, TN 38134
Raleigh NeighborhoodEstimated Value: $211,000 - $217,028
4
Beds
2
Baths
1,938
Sq Ft
$110/Sq Ft
Est. Value
About This Home
This home is located at 2088 Hampton Hill Dr, Memphis, TN 38134 and is currently estimated at $214,007, approximately $110 per square foot. 2088 Hampton Hill Dr is a home located in Shelby County with nearby schools including Shelby Oaks Elementary School, Kingsbury High School, and Kate Bond Middle School.
Ownership History
Date
Name
Owned For
Owner Type
Purchase Details
Closed on
Jan 31, 2005
Sold by
Voyles Michael
Bought by
Ferguson Vicki D
Current Estimated Value
Purchase Details
Closed on
Feb 7, 2002
Sold by
Ferguson Vicki D
Bought by
Ferguson Vicki D and Voyles Michael
Purchase Details
Closed on
Nov 28, 2001
Sold by
Lyons James Hardy and Voyles Michael
Bought by
Ferguson Vicki D
Home Financials for this Owner
Home Financials are based on the most recent Mortgage that was taken out on this home.
Original Mortgage
$51,500
Interest Rate
6.6%
Purchase Details
Closed on
Apr 12, 2000
Sold by
Ferguson Vicki D
Bought by
Ferguson Vicki D and Voyles Michael
Home Financials for this Owner
Home Financials are based on the most recent Mortgage that was taken out on this home.
Original Mortgage
$49,975
Interest Rate
8.27%
Purchase Details
Closed on
Jun 16, 1997
Sold by
Ferguson John E
Bought by
Ferguson Vicki D
Create a Home Valuation Report for This Property
The Home Valuation Report is an in-depth analysis detailing your home's value as well as a comparison with similar homes in the area
Home Values in the Area
Average Home Value in this Area
Purchase History
| Date | Buyer | Sale Price | Title Company |
|---|---|---|---|
| Ferguson Vicki D | -- | -- | |
| Ferguson Vicki D | -- | -- | |
| Ferguson Vicki D | -- | -- | |
| Ferguson Vicki D | -- | -- | |
| Ferguson Vicki D | -- | -- |
Source: Public Records
Mortgage History
| Date | Status | Borrower | Loan Amount |
|---|---|---|---|
| Previous Owner | Ferguson Vicki D | $51,500 | |
| Previous Owner | Ferguson Vicki D | $49,975 |
Source: Public Records
Tax History Compared to Growth
Tax History
| Year | Tax Paid | Tax Assessment Tax Assessment Total Assessment is a certain percentage of the fair market value that is determined by local assessors to be the total taxable value of land and additions on the property. | Land | Improvement |
|---|---|---|---|---|
| 2025 | $1,414 | $54,775 | $6,250 | $48,525 |
| 2024 | $1,414 | $41,725 | $5,000 | $36,725 |
| 2023 | $2,542 | $41,725 | $5,000 | $36,725 |
| 2022 | $2,542 | $41,725 | $5,000 | $36,725 |
| 2021 | $2,572 | $41,725 | $5,000 | $36,725 |
| 2020 | $1,768 | $24,400 | $5,000 | $19,400 |
| 2019 | $1,768 | $24,400 | $5,000 | $19,400 |
| 2018 | $1,768 | $24,400 | $5,000 | $19,400 |
| 2017 | $1,003 | $24,400 | $5,000 | $19,400 |
| 2016 | $988 | $22,600 | $0 | $0 |
| 2014 | $988 | $22,600 | $0 | $0 |
Source: Public Records
Map
Nearby Homes
- 5509 Rappahannock Dr
- 5345 Raleigh Lagrange Rd
- 1970 Adney Gap Dr
- 1962 Adney Gap Dr
- 5315 Pipers Gap Cove
- 5292 Pipers Gap Cove
- 5433 Pipers Gap Dr
- 5595 Raleigh Lagrange Rd
- 5616 Falling Bark Dr
- 5531 Quail Thicket Dr
- 2093 Penn Gap Cove
- 5577 Falling Bark Dr
- 2058 Olive Bark Cove
- 2050 Olive Bark Cove
- 5105 Pleasant View Rd
- 2373 W Monica Dr
- 1751 Fox Hunt Ln Unit 5
- 5573 Pleasant View Rd Unit 35
- 5554 Massey Station Rd
- 5594 Bartlett Woods Dr
- 2094 Hampton Hill Dr
- 2080 Hampton Hill Dr
- 2069 Shenandoah Dr
- 2065 Shenandoah Dr
- 2098 Hampton Hill Dr
- 2075 Shenandoah Dr
- 2068 Hampton Hill Dr
- 2093 Hampton Hill Dr
- 2081 Hampton Hill Dr
- 2057 Shenandoah Dr
- 2099 Hampton Hill Dr
- 2081 Shenandoah Dr
- 2058 Hampton Hill Dr
- 2075 Hampton Hill Dr
- 2104 Hampton Hill Dr
- 2109 Hampton Hill Dr
- 2102 Rock Ridge Rd
- 2067 Hampton Hill Dr
- 5365 Rock Ridge Rd S
- 5365 S Rock Ridge Rd