Estimated Value: $961,066 - $1,225,000
3
Beds
3
Baths
2,310
Sq Ft
$471/Sq Ft
Est. Value
About This Home
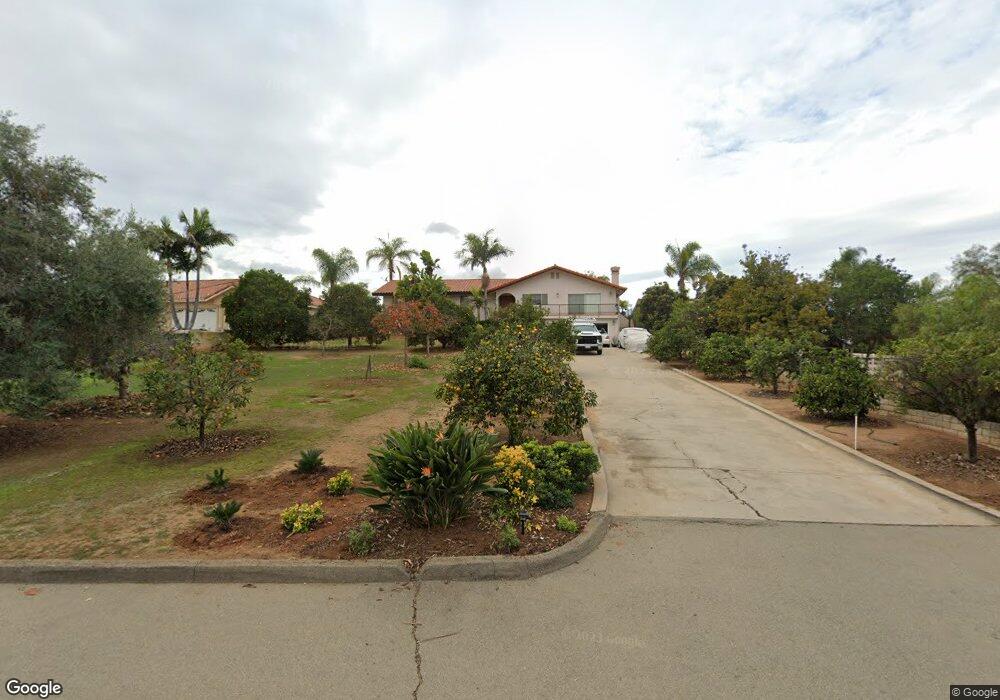
This home is located at 2088 Hawley Dr, Vista, CA 92084 and is currently estimated at $1,088,017, approximately $471 per square foot. 2088 Hawley Dr is a home located in San Diego County with nearby schools including Mission Meadows Elementary School, Roosevelt Middle School, and Vista High School.
Ownership History
Date
Name
Owned For
Owner Type
Purchase Details
Closed on
Oct 4, 2006
Sold by
Gabrielle Renato D and Gabriele Rosina
Bought by
Gabriele Renato D and Gabriele Rosina
Current Estimated Value
Home Financials for this Owner
Home Financials are based on the most recent Mortgage that was taken out on this home.
Original Mortgage
$600,000
Outstanding Balance
$333,549
Interest Rate
5.25%
Mortgage Type
Purchase Money Mortgage
Estimated Equity
$754,468
Purchase Details
Closed on
May 6, 1999
Sold by
Gabriele Renato D
Bought by
Gabriele Renato D and Gabriele Rosina
Purchase Details
Closed on
Dec 13, 1995
Sold by
Vlasovich Milanka and Undheim Robert N
Bought by
Hornik Michael and Hornik Marie
Home Financials for this Owner
Home Financials are based on the most recent Mortgage that was taken out on this home.
Original Mortgage
$100,000
Interest Rate
7.47%
Mortgage Type
Seller Take Back
Create a Home Valuation Report for This Property
The Home Valuation Report is an in-depth analysis detailing your home's value as well as a comparison with similar homes in the area
Purchase History
| Date | Buyer | Sale Price | Title Company |
|---|---|---|---|
| Gabriele Renato D | -- | Accommodation | |
| Gabrielle Renato D | -- | Lawyers Title San Diego | |
| Gabriele Renato D | -- | -- | |
| Hornik Michael | $115,000 | First American Title Co |
Source: Public Records
Mortgage History
| Date | Status | Borrower | Loan Amount |
|---|---|---|---|
| Open | Gabrielle Renato D | $600,000 | |
| Closed | Hornik Michael | $100,000 |
Source: Public Records
Tax History
| Year | Tax Paid | Tax Assessment Tax Assessment Total Assessment is a certain percentage of the fair market value that is determined by local assessors to be the total taxable value of land and additions on the property. | Land | Improvement |
|---|---|---|---|---|
| 2025 | $2,937 | $269,762 | $73,253 | $196,509 |
| 2024 | $2,937 | $264,473 | $71,817 | $192,656 |
| 2023 | $2,867 | $259,288 | $70,409 | $188,879 |
| 2022 | $2,859 | $254,205 | $69,029 | $185,176 |
| 2021 | $2,796 | $249,222 | $67,676 | $181,546 |
| 2020 | $2,787 | $246,668 | $66,983 | $179,685 |
| 2019 | $2,747 | $241,832 | $65,670 | $176,162 |
| 2018 | $2,612 | $237,091 | $64,383 | $172,708 |
| 2017 | $2,565 | $232,443 | $63,121 | $169,322 |
| 2016 | $2,504 | $227,886 | $61,884 | $166,002 |
| 2015 | $2,494 | $224,464 | $60,955 | $163,509 |
| 2014 | $2,434 | $220,068 | $59,761 | $160,307 |
Source: Public Records
Map
Nearby Homes
- 2060 E Vista Way
- 803 & 803 1/2 Taylor St
- 2076 Blue Oak Ln
- 2055 Riviera Dr Unit 195
- 1857 Autumn Ln
- 1658 San Luis Rey Ave
- 2318 Vista Grande Dr
- 646 Barsby St
- 1600 E Vista Way Unit 23
- 1600 E Vista Way Unit 128
- 1600 E Vista Way Unit 21
- 1600 E Vista Way Unit 38
- 1600 E Vista Way Unit 81
- 1126 Madera Ln
- 1649 San Luis Rey Ave
- 2090 Curtis Dr
- 1812 Hayden Ranch Rd
- 2080 Curtis Dr
- 1935 Cresthaven Dr
- 1921 Cresthaven Dr
- 2076 Hawley Dr
- 2090 Hawley Dr
- 0000 Hawley Dr
- 2049 Hawley Dr
- 2036 Hawley Dr
- 2034 Hawley Dr
- 2100 Hawley Dr
- 2104 Hawley Dr
- 1003 Via Marco
- 2050 Hawley Dr
- 1015 Corvalla Dr
- 2044 Hawley Dr
- 2033 Hawley Dr
- 2098 Hawley Dr
- 2040 Hawley Dr
- 2110 Hawley Dr
- 2042 Hawley Dr
- 1030 Corvalla Dr Unit 32
- 2094 Hawley Dr
- 0 Hawley Dr Unit PW16130089
Your Personal Tour Guide
Ask me questions while you tour the home.