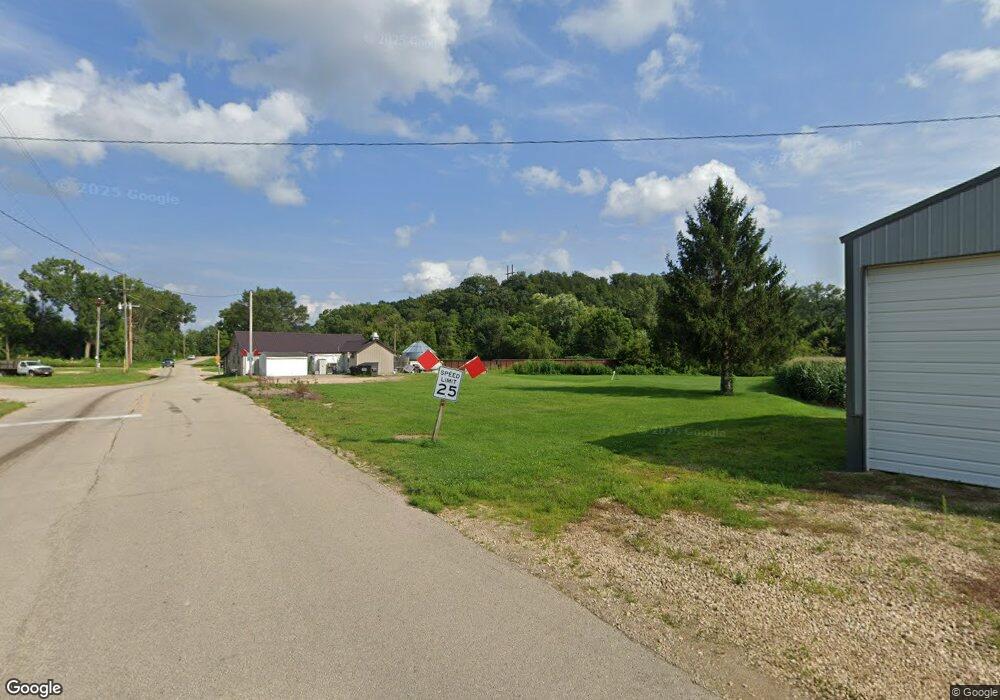
20880 Route 3 Durango, IA 52039
Estimated Value: $232,000 - $283,230
3
Beds
2
Baths
1,420
Sq Ft
$187/Sq Ft
Est. Value
About This Home
This home is located at 20880 Route 3, Durango, IA 52039 and is currently estimated at $266,058, approximately $187 per square foot. 20880 Route 3 is a home located in Dubuque County with nearby schools including Epworth Elementary School, Drexler Middle - Intermediate School, and Western Dubuque High School.
Create a Home Valuation Report for This Property
The Home Valuation Report is an in-depth analysis detailing your home's value as well as a comparison with similar homes in the area
Tax History
| Year | Tax Paid | Tax Assessment Tax Assessment Total Assessment is a certain percentage of the fair market value that is determined by local assessors to be the total taxable value of land and additions on the property. | Land | Improvement |
|---|---|---|---|---|
| 2025 | $2,394 | $268,500 | $55,700 | $212,800 |
| 2024 | $2,394 | $234,100 | $50,700 | $183,400 |
| 2023 | $2,294 | $234,100 | $50,700 | $183,400 |
| 2022 | $19 | $169,560 | $40,640 | $128,920 |
| 2021 | $1,934 | $169,560 | $40,640 | $128,920 |
| 2020 | $1,966 | $164,660 | $38,600 | $126,060 |
| 2019 | $2,048 | $164,660 | $38,600 | $126,060 |
| 2018 | $2,008 | $163,070 | $35,200 | $127,870 |
| 2017 | $1,912 | $163,070 | $35,200 | $127,870 |
| 2016 | $1,896 | $150,190 | $32,800 | $117,390 |
| 2015 | $1,896 | $150,190 | $32,800 | $117,390 |
| 2014 | $1,864 | $142,550 | $30,000 | $112,550 |
Source: Public Records
Map
Nearby Homes
- Lot 1-1 Sahm Addition
- 18927 Rte 3 Hwy
- Lots 3 & 4 5 Points Rd
- Lot 1 Twin Cedar Dr
- Lot 2 Twin Cedar Dr
- Lot 3 Twin Cedar Dr
- Lot 2-1 Creek Valley Acres
- 17234 Balltown Rd
- 860 Sunshine St
- 951 Parkview Dr
- 23363 Tollgate Rd
- Lot 1 of 3 Regency Dr
- 16978 Asbury Rd
- 2189 Tuscany Ridge Dr
- Lot 33 Tuscany Ridge Dr
- Lot 2 Tuscany Ridge Dr
- Lot 2-2 Hidden Meadows Dr
- 15441 Stacie Ct
- 17000 Mountain Ridge
- Lot 22 Keegan Ct
- 20906 Route 3
- 20908 Highway 52 N
- 20886 Highway 52 N
- 20868 Route 3 Route
- 20868 N 52 Hwy
- 20868 Highway 52 N
- 20846 Highway 52 N
- 20824 Highway 52 N
- 20824 Hwy 52 N
- 20824 Iowa 3
- 20824 Route 3
- 20835 Route 3
- 20798 Route 3 Route
- 20798 Highway 52 N
- 20785 Highway 52 N
- 20768 N Rt 52
- 20732 Highway 52 N
- 20750 Highway 52 N
- 581 Hilltop Ct
- 21187 Route 3
Your Personal Tour Guide
Ask me questions while you tour the home.