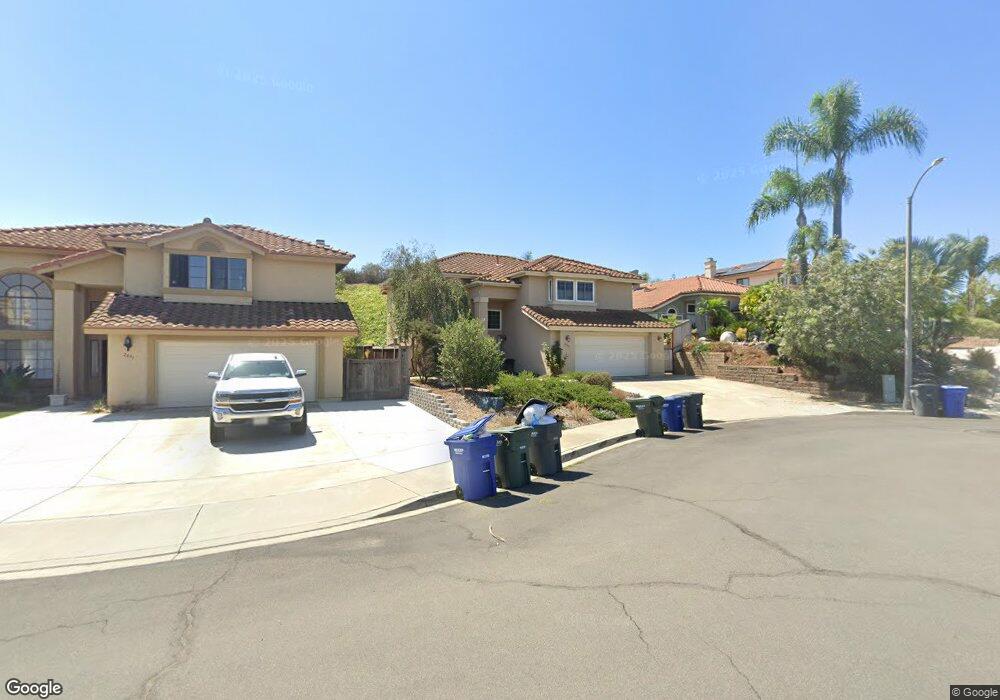
2089 Sequoia Crest Vista, CA 92081
Rancho Carlsbad NeighborhoodEstimated Value: $1,115,000 - $1,207,000
4
Beds
3
Baths
2,189
Sq Ft
$537/Sq Ft
Est. Value
About This Home
This home is located at 2089 Sequoia Crest, Vista, CA 92081 and is currently estimated at $1,176,075, approximately $537 per square foot. 2089 Sequoia Crest is a home located in San Diego County with nearby schools including Lake Elementary School, Madison Middle School, and Rancho Buena Vista High School.
Ownership History
Date
Name
Owned For
Owner Type
Purchase Details
Closed on
Jun 28, 2021
Sold by
Kemp Ronald C and Kemp Laurie H
Bought by
Kemp Ronald C and Kemp Laurie H
Current Estimated Value
Purchase Details
Closed on
Jun 28, 2004
Sold by
Denny T Kevin and Denny Carolee
Bought by
Kemp Ronald C and Kemp Laurie H
Home Financials for this Owner
Home Financials are based on the most recent Mortgage that was taken out on this home.
Original Mortgage
$476,000
Outstanding Balance
$226,513
Interest Rate
5.5%
Mortgage Type
New Conventional
Estimated Equity
$949,562
Purchase Details
Closed on
May 22, 1997
Sold by
Ikemoto Cary G
Bought by
Denny T Kevin and Denny Carolee
Home Financials for this Owner
Home Financials are based on the most recent Mortgage that was taken out on this home.
Original Mortgage
$198,550
Interest Rate
7.83%
Purchase Details
Closed on
Jun 10, 1988
Create a Home Valuation Report for This Property
The Home Valuation Report is an in-depth analysis detailing your home's value as well as a comparison with similar homes in the area
Home Values in the Area
Average Home Value in this Area
Purchase History
| Date | Buyer | Sale Price | Title Company |
|---|---|---|---|
| Kemp Ronald C | -- | None Available | |
| Kemp Ronald C | $595,000 | Southland Title | |
| Denny T Kevin | $209,000 | Fidelity National Title | |
| -- | $163,000 | -- |
Source: Public Records
Mortgage History
| Date | Status | Borrower | Loan Amount |
|---|---|---|---|
| Open | Kemp Ronald C | $476,000 | |
| Previous Owner | Denny T Kevin | $198,550 | |
| Closed | Kemp Ronald C | $30,000 |
Source: Public Records
Tax History Compared to Growth
Tax History
| Year | Tax Paid | Tax Assessment Tax Assessment Total Assessment is a certain percentage of the fair market value that is determined by local assessors to be the total taxable value of land and additions on the property. | Land | Improvement |
|---|---|---|---|---|
| 2025 | $9,391 | $829,307 | $529,643 | $299,664 |
| 2024 | $9,391 | $813,047 | $519,258 | $293,789 |
| 2023 | $9,348 | $797,106 | $509,077 | $288,029 |
| 2022 | $9,207 | $781,478 | $499,096 | $282,382 |
| 2021 | $9,132 | $766,156 | $489,310 | $276,846 |
| 2020 | $7,594 | $625,000 | $230,000 | $395,000 |
| 2019 | $7,606 | $625,000 | $230,000 | $395,000 |
| 2018 | $7,225 | $605,000 | $223,000 | $382,000 |
| 2017 | $7,016 | $585,000 | $216,000 | $369,000 |
| 2016 | $6,130 | $510,000 | $189,000 | $321,000 |
| 2015 | $5,637 | $460,000 | $171,000 | $289,000 |
| 2014 | $5,509 | $450,000 | $168,000 | $282,000 |
Source: Public Records
Map
Nearby Homes
- 4888 Thebes Way
- 6055 Dassia Way
- 1916 Rosewood St
- 1930 Rosewood St
- 2042 Redwood Crest
- 1829 Shadowood Cir
- 4994 Alicante Way
- 4142 Rhodes Way
- 4169 Rhodes Way
- 4946 Kalamis Way
- 4908 Keos Way
- 1632 Mountain Pass Cir
- 4780 Miletus Way
- 4058 Lemnos Way
- 2225 Baxter Canyon Rd
- 4763 Galicia Way
- 4737 Galicia Way
- 1746 Country Squire
- 1745 Crystal Ridge Way
- 4695 Adra Way
- 2091 Sequoia Crest
- 2087 Sequoia Crest
- 2093 Sequoia Crest
- 2085 Sequoia Crest
- 2083 Sequoia Crest
- 2095 Sequoia Crest
- 2088 Sequoia Crest
- 2097 Sequoia Crest
- 2081 Sequoia Crest
- 2094 Sequoia Crest
- 2082 Sequoia Crest
- 2098 Sequoia Crest
- 2077 Sequoia Crest
- 2076 Sequoia Crest
- 2090 White Birch Dr
- 2075 Sequoia Crest
- 2074 Sequoia Crest
- 2086 White Birch Dr
- 2130 White Birch Dr
- 2071 Sequoia Crest