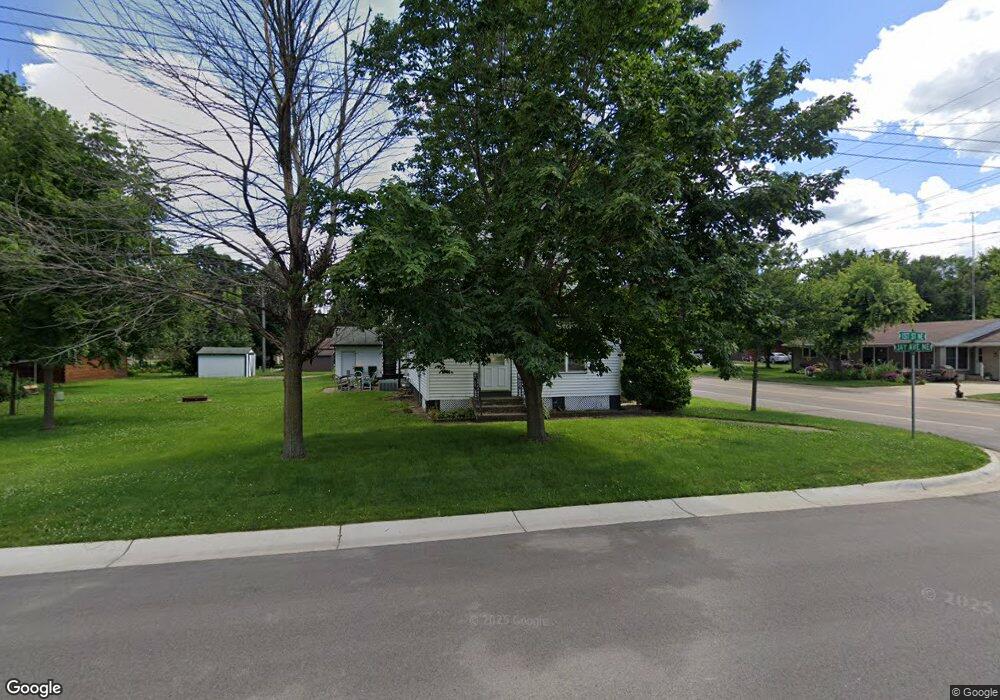
209 1st St NE Richmond, MN 56368
Estimated Value: $237,000 - $289,000
3
Beds
2
Baths
1,364
Sq Ft
$197/Sq Ft
Est. Value
About This Home
This home is located at 209 1st St NE, Richmond, MN 56368 and is currently estimated at $268,418, approximately $196 per square foot. 209 1st St NE is a home located in Stearns County with nearby schools including Rocori Senior High School, Saints Peter & Paul Catholic School, and Dei Spring Academy.
Ownership History
Date
Name
Owned For
Owner Type
Purchase Details
Closed on
Jan 7, 2025
Sold by
Krippner Travis
Bought by
Ott Brenden Jacob
Current Estimated Value
Home Financials for this Owner
Home Financials are based on the most recent Mortgage that was taken out on this home.
Original Mortgage
$219,220
Outstanding Balance
$217,698
Interest Rate
6.81%
Mortgage Type
New Conventional
Estimated Equity
$50,720
Purchase Details
Closed on
Dec 31, 2024
Sold by
Krippner Travis
Bought by
Ott Brenden
Home Financials for this Owner
Home Financials are based on the most recent Mortgage that was taken out on this home.
Original Mortgage
$219,220
Outstanding Balance
$217,698
Interest Rate
6.81%
Mortgage Type
New Conventional
Estimated Equity
$50,720
Purchase Details
Closed on
Dec 26, 2018
Sold by
Ward Olivia S
Bought by
Krippner Travis M
Purchase Details
Closed on
Nov 4, 2016
Sold by
K. A. and K. Wendy
Bought by
S. M. and S. Ward,Olivia
Create a Home Valuation Report for This Property
The Home Valuation Report is an in-depth analysis detailing your home's value as well as a comparison with similar homes in the area
Home Values in the Area
Average Home Value in this Area
Purchase History
| Date | Buyer | Sale Price | Title Company |
|---|---|---|---|
| Ott Brenden Jacob | $226,000 | First American Title | |
| Ott Brenden | $226,000 | -- | |
| Krippner Travis M | -- | -- | |
| S. M. | $150,000 | -- |
Source: Public Records
Mortgage History
| Date | Status | Borrower | Loan Amount |
|---|---|---|---|
| Open | Ott Brenden Jacob | $219,220 | |
| Closed | Ott Brenden | $226,000 |
Source: Public Records
Tax History Compared to Growth
Tax History
| Year | Tax Paid | Tax Assessment Tax Assessment Total Assessment is a certain percentage of the fair market value that is determined by local assessors to be the total taxable value of land and additions on the property. | Land | Improvement |
|---|---|---|---|---|
| 2025 | $3,782 | $230,600 | $38,000 | $192,600 |
| 2024 | $3,782 | $211,500 | $38,000 | $173,500 |
| 2023 | $2,128 | $191,900 | $35,000 | $156,900 |
| 2022 | $2,064 | $158,900 | $32,000 | $126,900 |
| 2021 | $2,040 | $158,900 | $32,000 | $126,900 |
| 2020 | $2,050 | $156,300 | $32,000 | $124,300 |
| 2019 | $2,064 | $150,400 | $29,500 | $120,900 |
| 2018 | $1,510 | $113,800 | $27,500 | $86,300 |
| 2017 | $1,418 | $107,700 | $27,500 | $80,200 |
| 2016 | $2,098 | $0 | $0 | $0 |
| 2015 | $2,032 | $0 | $0 | $0 |
| 2014 | -- | $0 | $0 | $0 |
Source: Public Records
Map
Nearby Homes
- 232 Main St E
- 448 1st St NE
- 153 Central Ave S
- 148 Main St W
- 205 Grant Ave SW
- 22296 Hall Ave SW
- 22579 Fordham Rd
- 101 Barry Loop NW
- XXX Eastfield Dr
- 21107 State Highway 23
- 20734 Black Cherry Dr
- 21312 State Highway 22 #4
- 21312 State Highway 22 Unit 25
- 21312 State Highway 22 Unit 20
- 22314 Mallard Ct
- 19497 Cedar Island Lake Rd
- 21161 Elkview Cir
- 17473 Fairway Cir
- 20554 Elkview Ct
- 20568 Elkview Ct