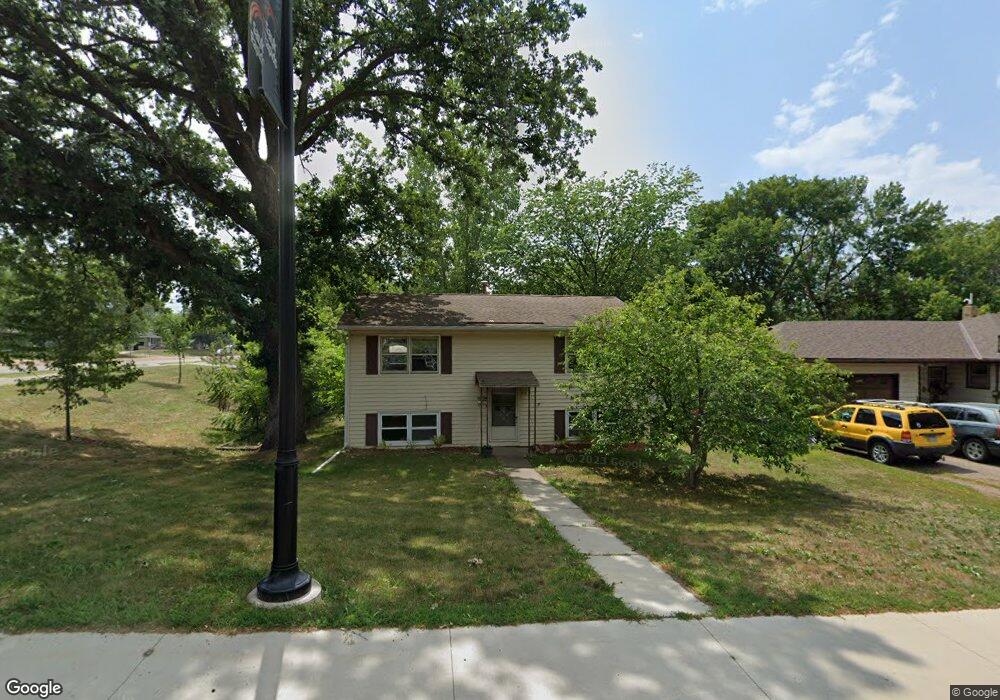
209 6th Ave N Sauk Rapids, MN 56379
Estimated Value: $183,000 - $206,000
4
Beds
2
Baths
1,536
Sq Ft
$128/Sq Ft
Est. Value
About This Home
This home is located at 209 6th Ave N, Sauk Rapids, MN 56379 and is currently estimated at $196,664, approximately $128 per square foot. 209 6th Ave N is a home located in Benton County with nearby schools including Pleasant View Elementary School, Sauk Rapids-Rice Middle School, and Sauk Rapids-Rice Senior High School.
Ownership History
Date
Name
Owned For
Owner Type
Purchase Details
Closed on
Aug 20, 2020
Sold by
Real Estte Results Inc
Bought by
Hoaglund Sara Rae Nasca and Hoaglund Luke Mychal
Current Estimated Value
Purchase Details
Closed on
Apr 30, 2020
Sold by
U S Bank National Association
Bought by
Real Estate Results Inc
Purchase Details
Closed on
Aug 22, 2019
Sold by
Harne Melissa A and Johnson Lauren M
Bought by
Us Bank National Association
Purchase Details
Closed on
Apr 14, 2006
Sold by
Zahn Gerald F and Zahn Lois
Bought by
Harne Mellssa A and Johnson Lauren M
Home Financials for this Owner
Home Financials are based on the most recent Mortgage that was taken out on this home.
Original Mortgage
$125,660
Interest Rate
6.48%
Mortgage Type
New Conventional
Create a Home Valuation Report for This Property
The Home Valuation Report is an in-depth analysis detailing your home's value as well as a comparison with similar homes in the area
Home Values in the Area
Average Home Value in this Area
Purchase History
| Date | Buyer | Sale Price | Title Company |
|---|---|---|---|
| Hoaglund Sara Rae Nasca | $137,900 | Watermark Title Agency | |
| Real Estate Results Inc | $70,000 | None Available | |
| Us Bank National Association | $131,750 | None Available | |
| Harne Mellssa A | $125,478 | -- |
Source: Public Records
Mortgage History
| Date | Status | Borrower | Loan Amount |
|---|---|---|---|
| Previous Owner | Harne Mellssa A | $125,660 |
Source: Public Records
Tax History Compared to Growth
Tax History
| Year | Tax Paid | Tax Assessment Tax Assessment Total Assessment is a certain percentage of the fair market value that is determined by local assessors to be the total taxable value of land and additions on the property. | Land | Improvement |
|---|---|---|---|---|
| 2025 | $1,618 | $160,500 | $25,000 | $135,500 |
| 2024 | $1,664 | $154,200 | $25,000 | $129,200 |
| 2023 | $1,578 | $156,600 | $25,000 | $131,600 |
| 2022 | $1,416 | $139,100 | $22,800 | $116,300 |
| 2021 | $1,642 | $118,700 | $22,800 | $95,900 |
| 2020 | $1,652 | $110,300 | $21,900 | $88,400 |
| 2018 | $1,162 | $100,800 | $21,900 | $78,900 |
| 2017 | $1,162 | $66,500 | $15,298 | $51,202 |
| 2016 | $1,136 | $95,200 | $21,900 | $73,300 |
| 2015 | $1,140 | $60,800 | $14,811 | $45,989 |
| 2014 | -- | $57,300 | $14,474 | $42,826 |
| 2013 | -- | $58,200 | $14,550 | $43,650 |
Source: Public Records
Map
Nearby Homes
- 117 6th Ave N
- 216 8th Ave N
- 615 3rd Ave N
- 112 Summit Ave S
- 100 9th Ave S
- 224 9th St N
- 1101 10th Ave N
- 1107 10th Ave N
- 1105 Summit Ave N
- 752 12th St N
- 314 Pleasant Ridge Dr
- 1201 10th Ave N
- 3322 321st St
- 3300 321st St
- 608 Summit Ave S
- 1018 N Benton Dr
- 2021 Hillcrest Dr
- 32467 County Road 1
- 2161 Mill Pond Dr
- 1209 Millstone Ct