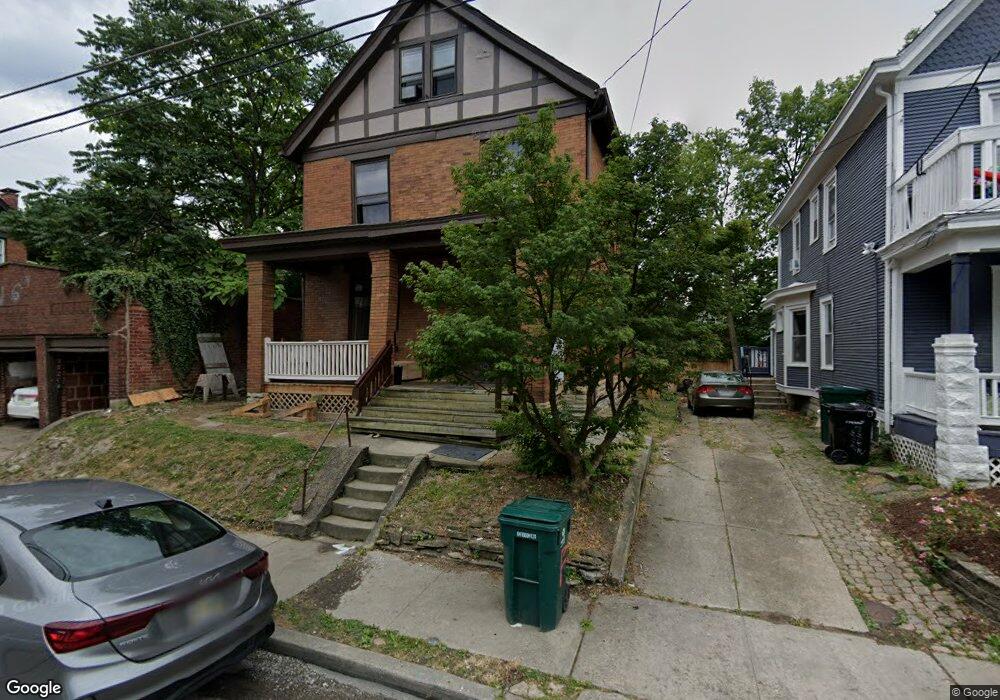
209 Atkinson St Cincinnati, OH 45219
Clifton NeighborhoodEstimated Value: $297,000 - $374,000
5
Beds
2
Baths
2,074
Sq Ft
$163/Sq Ft
Est. Value
About This Home
This home is located at 209 Atkinson St, Cincinnati, OH 45219 and is currently estimated at $337,085, approximately $162 per square foot. 209 Atkinson St is a home located in Hamilton County with nearby schools including Clifton Area Neighborhood School, Robert A. Taft Information Technology High School, and Gilbert A. Dater High School.
Ownership History
Date
Name
Owned For
Owner Type
Purchase Details
Closed on
Mar 15, 2002
Sold by
Masfi James
Bought by
Tepperberg Alfredo S and Tepperberg Sharon
Current Estimated Value
Purchase Details
Closed on
Jan 16, 2000
Sold by
Miller Iain M and Daniels Malcolm W
Bought by
Netanel Amit and Netanel Deborah
Home Financials for this Owner
Home Financials are based on the most recent Mortgage that was taken out on this home.
Original Mortgage
$107,350
Interest Rate
7.58%
Purchase Details
Closed on
Mar 14, 1995
Sold by
Wolf Donald E
Bought by
Miller Iain M and Daniels Malcolm W
Home Financials for this Owner
Home Financials are based on the most recent Mortgage that was taken out on this home.
Original Mortgage
$90,155
Interest Rate
8.97%
Purchase Details
Closed on
Apr 1, 1994
Sold by
Wolf Janine M
Bought by
Wolf Donald E
Create a Home Valuation Report for This Property
The Home Valuation Report is an in-depth analysis detailing your home's value as well as a comparison with similar homes in the area
Home Values in the Area
Average Home Value in this Area
Purchase History
| Date | Buyer | Sale Price | Title Company |
|---|---|---|---|
| Tepperberg Alfredo S | $50,000 | -- | |
| Netanel Amit | $113,000 | -- | |
| Miller Iain M | -- | -- | |
| Wolf Donald E | -- | -- | |
| Wolf Donald E | -- | -- |
Source: Public Records
Mortgage History
| Date | Status | Borrower | Loan Amount |
|---|---|---|---|
| Previous Owner | Netanel Amit | $107,350 | |
| Previous Owner | Miller Iain M | $90,155 |
Source: Public Records
Tax History
| Year | Tax Paid | Tax Assessment Tax Assessment Total Assessment is a certain percentage of the fair market value that is determined by local assessors to be the total taxable value of land and additions on the property. | Land | Improvement |
|---|---|---|---|---|
| 2025 | $4,675 | $73,717 | $16,254 | $57,463 |
| 2024 | $4,668 | $73,717 | $16,254 | $57,463 |
| 2023 | $4,677 | $73,717 | $16,254 | $57,463 |
| 2022 | $4,023 | $57,030 | $6,178 | $50,852 |
| 2021 | $3,954 | $57,030 | $6,178 | $50,852 |
| 2020 | $3,965 | $57,030 | $6,178 | $50,852 |
| 2019 | $3,821 | $50,026 | $5,418 | $44,608 |
| 2018 | $3,824 | $50,026 | $5,418 | $44,608 |
| 2017 | $3,683 | $50,026 | $5,418 | $44,608 |
| 2016 | $3,403 | $45,077 | $5,215 | $39,862 |
| 2015 | $3,042 | $45,077 | $5,215 | $39,862 |
| 2014 | $3,058 | $45,077 | $5,215 | $39,862 |
| 2013 | $2,803 | $40,607 | $4,697 | $35,910 |
Source: Public Records
Map
Nearby Homes
- 209 Atkinson St
- 213 Atkinson St
- 215 Atkinson St
- 2321 Moerlein Ave
- 2319 Moerlein Ave
- 219 Atkinson St
- 210 Bosley St
- 2317 Moerlein Ave
- 212 Bosley St
- 2323 Moerlein Ave
- 2315 Moerlein Ave
- 214 Bosley St
- 221 Atkinson St
- 2313 Moerlein Ave
- 216 Atkinson St
- 216 Bosley St
- 223 Atkinson St
- 218 Bosley St
- 220 Atkinson St
- 200 Atkinson St
Your Personal Tour Guide
Ask me questions while you tour the home.