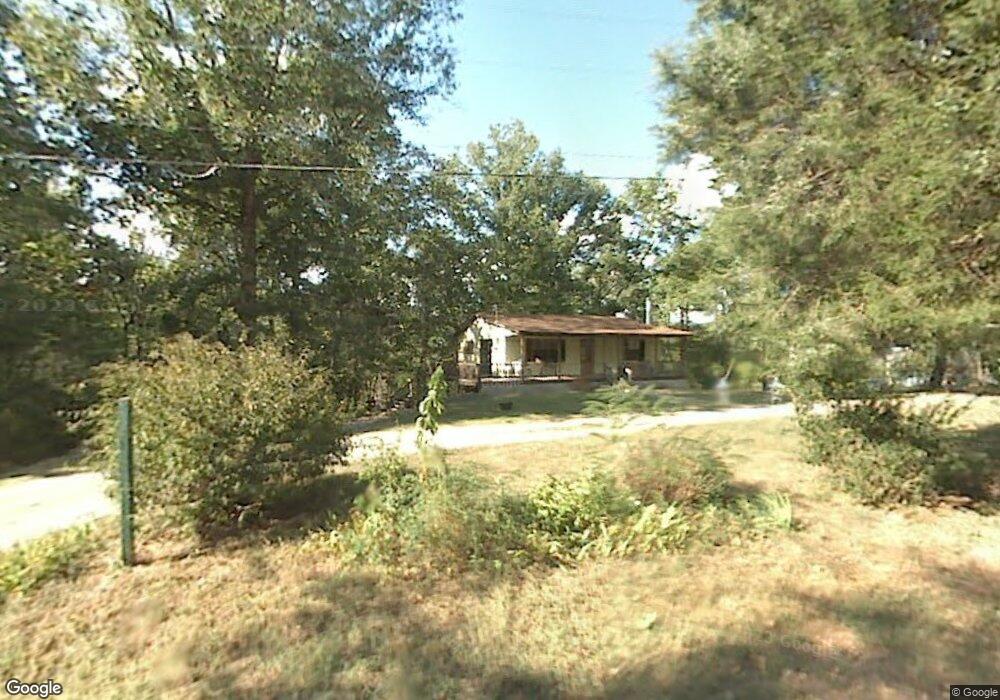
209 Chapman Rd Dunlap, TN 37327
Estimated Value: $111,000 - $431,000
--
Bed
--
Bath
864
Sq Ft
$312/Sq Ft
Est. Value
About This Home
This home is located at 209 Chapman Rd, Dunlap, TN 37327 and is currently estimated at $269,321, approximately $311 per square foot. 209 Chapman Rd is a home with nearby schools including Bledsoe County High School.
Ownership History
Date
Name
Owned For
Owner Type
Purchase Details
Closed on
Mar 21, 2022
Sold by
Timothy Dunham
Bought by
Hobbs Clinton
Current Estimated Value
Purchase Details
Closed on
Mar 2, 2021
Sold by
Cagle Nathurn and Dunham Christine A
Bought by
Hobbs Clinton
Purchase Details
Closed on
May 31, 2019
Sold by
Harvey Richard
Bought by
Hobbs Clinton
Purchase Details
Closed on
Mar 13, 1998
Sold by
Dunham Christine
Bought by
Dunham Christine A
Purchase Details
Closed on
Jun 30, 1981
Bought by
Wyatt Louise
Purchase Details
Closed on
Jan 1, 1981
Create a Home Valuation Report for This Property
The Home Valuation Report is an in-depth analysis detailing your home's value as well as a comparison with similar homes in the area
Home Values in the Area
Average Home Value in this Area
Purchase History
| Date | Buyer | Sale Price | Title Company |
|---|---|---|---|
| Hobbs Clinton | -- | None Listed On Document | |
| Hobbs Clinton | -- | None Available | |
| Hobbs Clinton | -- | None Available | |
| Dunham Christine A | $30,000 | -- | |
| Wyatt Louise | -- | -- | |
| -- | $6,000 | -- |
Source: Public Records
Tax History Compared to Growth
Tax History
| Year | Tax Paid | Tax Assessment Tax Assessment Total Assessment is a certain percentage of the fair market value that is determined by local assessors to be the total taxable value of land and additions on the property. | Land | Improvement |
|---|---|---|---|---|
| 2024 | $536 | $26,000 | $6,775 | $19,225 |
| 2023 | $536 | $26,000 | $6,775 | $19,225 |
| 2022 | $487 | $26,000 | $6,775 | $19,225 |
| 2021 | $487 | $20,400 | $5,225 | $15,175 |
| 2020 | $487 | $20,400 | $5,225 | $15,175 |
| 2019 | $487 | $20,400 | $5,225 | $15,175 |
| 2018 | $450 | $20,400 | $5,225 | $15,175 |
| 2017 | $450 | $20,400 | $5,225 | $15,175 |
| 2016 | $466 | $20,575 | $6,200 | $14,375 |
| 2015 | $456 | $20,575 | $6,200 | $14,375 |
| 2014 | $456 | $20,575 | $6,200 | $14,375 |
Source: Public Records
Map
Nearby Homes
- 280 Chapman Rd
- 18 Old State Highway 28
- 134 Mcwilliams Rd
- 3 Lusk Loop Rd
- 37 Golden St
- 2604 Lower East Valley Rd
- 442 Billingsley Rd
- 91 Lightning Ln
- 91 Hidden View Dr
- 0 Old State Highway 28
- 500 Old Highway 28
- 16 Old State Hwy 28
- 0 Old Highway 28
- 19 Lower Brow Rd
- 1 Old Highway 28
- 1108 Neergaard Ln
- 415 Neergaard Ln
- 0 Bill Pope Dr
- 46 Dry Branch Way
- Lot 45 Dry Branch Way
- 227 Chapman Rd
- 157 Chapman Rd
- 785 Howard Beavert Rd
- 291 Chapman Rd
- 801 Howard Beavert Rd
- 304 Chapman Rd
- 629 Howard Beavert Rd
- 831 Howard Beavert Rd
- 724 Howard Beavert Rd
- 0 Chapman Rd Unit 4277
- 0 Chapman Rd Unit 5042
- 0 Chapman Rd Unit 1300535
- 0 Chapman Rd Unit 1281768
- 0 Chapman Rd Unit 1263429
- 0 Chapman Rd Unit 1245554
- 0 Chapman Rd Unit 1076071
- 0 Chapman Rd Unit 1015930
- 0 Chapman Rd Unit 1085972
- 0 Chapman Rd Unit 12104
- 0 Chapman Rd