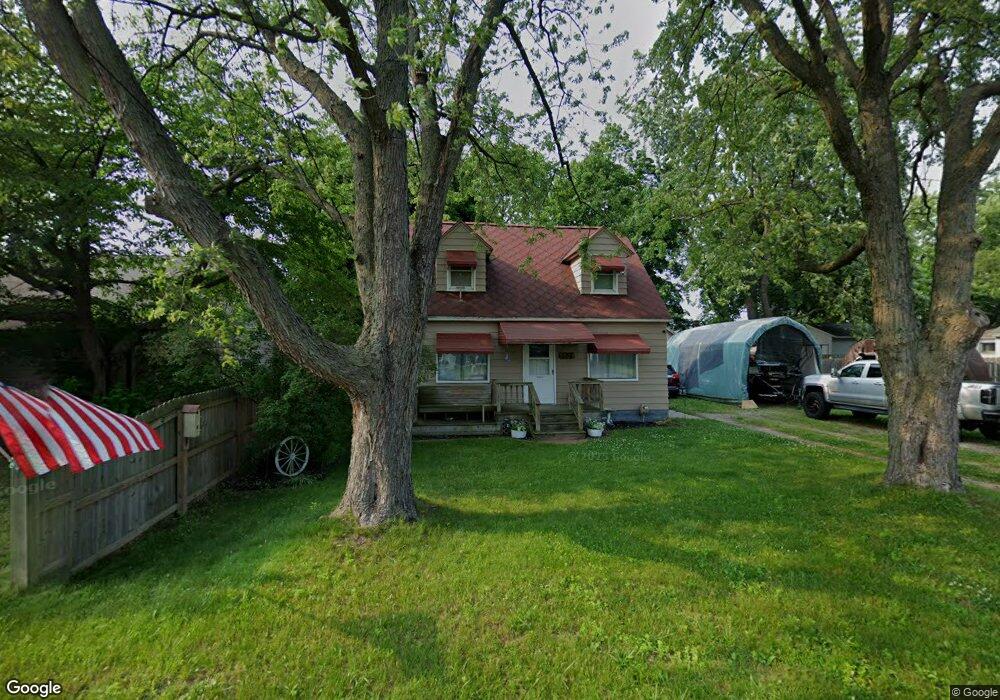
209 Della St Portage, MI 49002
Estimated Value: $200,000 - $213,808
3
Beds
1
Bath
1,375
Sq Ft
$152/Sq Ft
Est. Value
About This Home
This home is located at 209 Della St, Portage, MI 49002 and is currently estimated at $208,702, approximately $151 per square foot. 209 Della St is a home located in Kalamazoo County with nearby schools including Woodland Elementary School, Portage North Middle School, and Portage Northern High School.
Ownership History
Date
Name
Owned For
Owner Type
Purchase Details
Closed on
Dec 15, 2021
Sold by
Martini Kris M
Bought by
Martini Kris M and Martini Nicole J
Current Estimated Value
Purchase Details
Closed on
Jun 4, 2007
Sold by
Mortgage Electronic Registration Systems
Bought by
Bank Of New York and Cwalt Inc Alternative Loan Trust 2005-20
Purchase Details
Closed on
Mar 15, 2007
Sold by
Weyenberg Paul A
Bought by
Martini Kris M and Burlew Nicole J
Home Financials for this Owner
Home Financials are based on the most recent Mortgage that was taken out on this home.
Original Mortgage
$86,417
Interest Rate
6.4%
Mortgage Type
FHA
Purchase Details
Closed on
Jul 9, 2004
Sold by
Weyenberg Ronald L and Oman Mary Lou
Bought by
Weyenberg Paul A
Home Financials for this Owner
Home Financials are based on the most recent Mortgage that was taken out on this home.
Original Mortgage
$76,000
Interest Rate
6.42%
Mortgage Type
New Conventional
Create a Home Valuation Report for This Property
The Home Valuation Report is an in-depth analysis detailing your home's value as well as a comparison with similar homes in the area
Home Values in the Area
Average Home Value in this Area
Purchase History
| Date | Buyer | Sale Price | Title Company |
|---|---|---|---|
| Martini Kris M | -- | None Listed On Document | |
| Bank Of New York | -- | None Available | |
| Martini Kris M | $87,100 | Trans | |
| Mortgage Electronic Registration Systems | $40,120 | None Available | |
| Weyenberg Paul A | -- | Chicago Title |
Source: Public Records
Mortgage History
| Date | Status | Borrower | Loan Amount |
|---|---|---|---|
| Previous Owner | Martini Kris M | $86,417 | |
| Previous Owner | Weyenberg Paul A | $76,000 |
Source: Public Records
Tax History Compared to Growth
Tax History
| Year | Tax Paid | Tax Assessment Tax Assessment Total Assessment is a certain percentage of the fair market value that is determined by local assessors to be the total taxable value of land and additions on the property. | Land | Improvement |
|---|---|---|---|---|
| 2025 | $2,452 | $79,500 | $0 | $0 |
| 2024 | $2,158 | $84,000 | $0 | $0 |
| 2023 | $2,057 | $72,100 | $0 | $0 |
| 2022 | $2,223 | $69,500 | $0 | $0 |
| 2021 | $2,148 | $63,400 | $0 | $0 |
| 2020 | $2,102 | $59,100 | $0 | $0 |
| 2019 | $189 | $50,400 | $0 | $0 |
| 2018 | $0 | $48,100 | $0 | $0 |
| 2017 | $0 | $50,800 | $0 | $0 |
| 2016 | -- | $46,200 | $0 | $0 |
| 2015 | -- | $45,300 | $0 | $0 |
| 2014 | -- | $42,700 | $0 | $0 |
Source: Public Records
Map
Nearby Homes
- 509 Della St
- 520 Della St
- 213 E van Hoesen Blvd
- 5824 Concord St
- 600 W Milham Ave Unit 1 - VL
- 600 W Milham Ave
- 7090 S Westnedge Ave
- 505 W van Hoesen Blvd
- 6500 Lovers Ln
- 6741 Lovers Ln
- 6325 Avon St
- 7117 White Oak Cir
- 7243 S Westnedge Ave
- 5747 Utah Ave
- 1010 Romence Rd
- 7313 S Westnedge Ave
- 7237 White Oak Cir
- 1332 Sussex St
- 5546 Outer Dr
- 218 Amos Ave