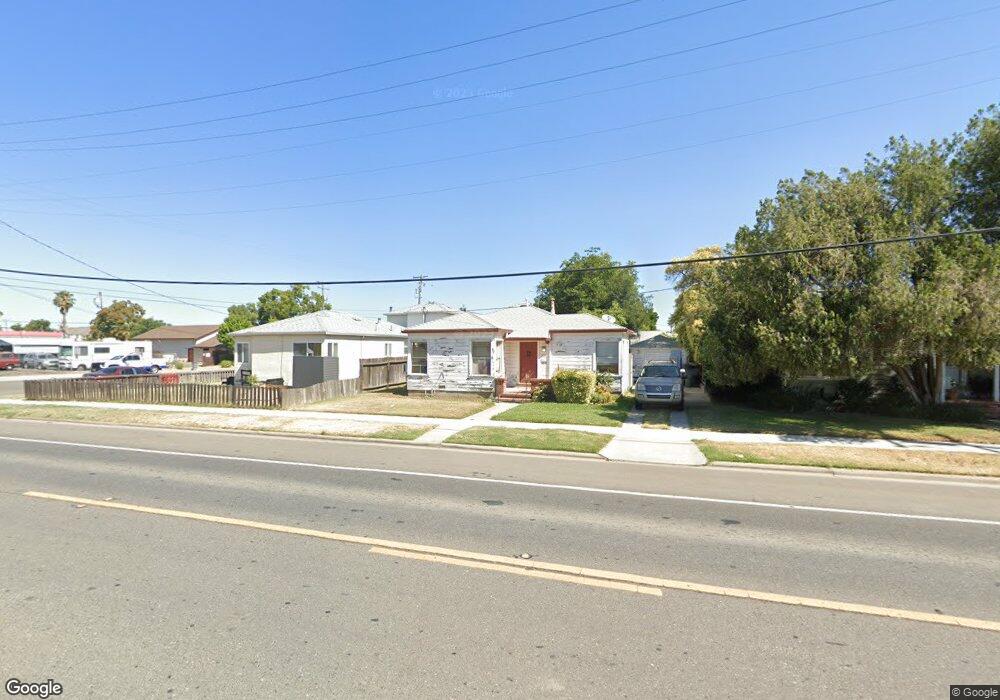
209 E 12th St Marysville, CA 95901
Estimated Value: $225,526 - $300,000
2
Beds
1
Bath
830
Sq Ft
$310/Sq Ft
Est. Value
About This Home
This home is located at 209 E 12th St, Marysville, CA 95901 and is currently estimated at $257,132, approximately $309 per square foot. 209 E 12th St is a home located in Yuba County with nearby schools including Kynoch Elementary School, Anna McKenney Intermediate, and Marysville High School.
Ownership History
Date
Name
Owned For
Owner Type
Purchase Details
Closed on
Oct 5, 2005
Sold by
Langdell Joseph K
Bought by
Langdell Theodore and Langdell Anita Okelleyburchett
Current Estimated Value
Home Financials for this Owner
Home Financials are based on the most recent Mortgage that was taken out on this home.
Original Mortgage
$90,328
Outstanding Balance
$48,073
Interest Rate
5.67%
Mortgage Type
Seller Take Back
Estimated Equity
$209,059
Create a Home Valuation Report for This Property
The Home Valuation Report is an in-depth analysis detailing your home's value as well as a comparison with similar homes in the area
Purchase History
| Date | Buyer | Sale Price | Title Company |
|---|---|---|---|
| Langdell Theodore | $90,500 | North State Title Company |
Source: Public Records
Mortgage History
| Date | Status | Borrower | Loan Amount |
|---|---|---|---|
| Open | Langdell Theodore | $90,328 |
Source: Public Records
Tax History
| Year | Tax Paid | Tax Assessment Tax Assessment Total Assessment is a certain percentage of the fair market value that is determined by local assessors to be the total taxable value of land and additions on the property. | Land | Improvement |
|---|---|---|---|---|
| 2025 | $851 | $76,517 | $32,558 | $43,959 |
| 2023 | $851 | $73,548 | $31,295 | $42,253 |
| 2022 | $925 | $72,107 | $30,682 | $41,425 |
| 2021 | $1,252 | $70,694 | $30,081 | $40,613 |
| 2020 | $1,529 | $69,970 | $29,773 | $40,197 |
| 2019 | $1,015 | $68,599 | $29,190 | $39,409 |
| 2018 | $768 | $67,255 | $28,618 | $38,637 |
| 2017 | $744 | $65,937 | $28,057 | $37,880 |
| 2016 | $1,159 | $64,645 | $27,507 | $37,138 |
| 2015 | $720 | $63,675 | $27,094 | $36,581 |
| 2014 | $708 | $62,429 | $26,564 | $35,865 |
Source: Public Records
Map
Nearby Homes
Your Personal Tour Guide
Ask me questions while you tour the home.