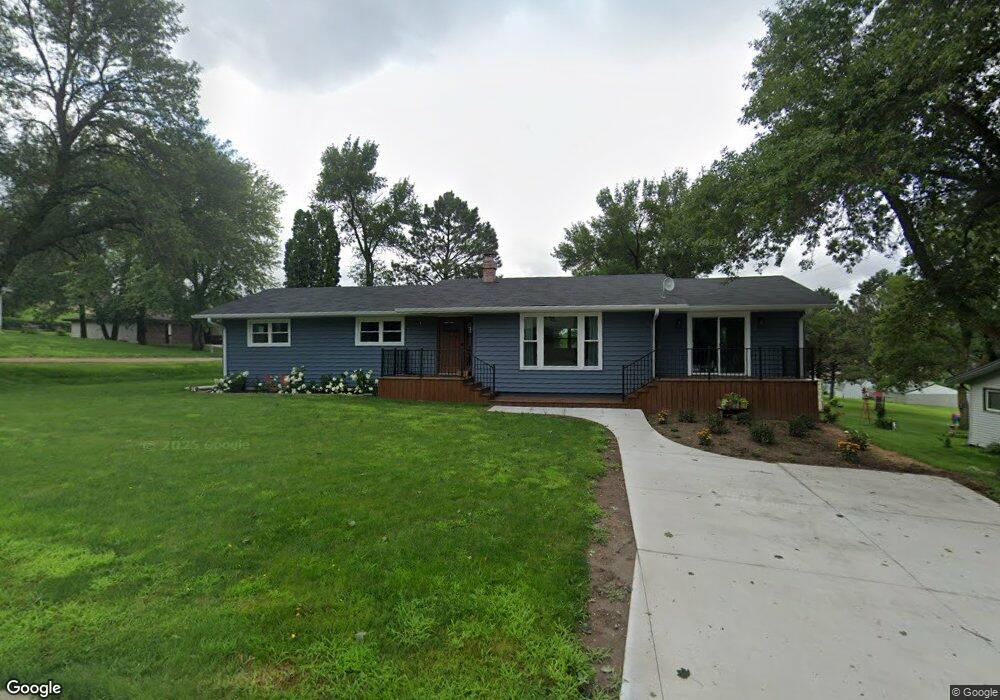
209 E Ciro St Bloomfield, NE 68718
Estimated Value: $91,000 - $164,412
3
Beds
2
Baths
1,713
Sq Ft
$80/Sq Ft
Est. Value
About This Home
This home is located at 209 E Ciro St, Bloomfield, NE 68718 and is currently estimated at $137,603, approximately $80 per square foot. 209 E Ciro St is a home located in Knox County with nearby schools including Bloomfield Elementary School and Bloomfield Junior/Senior High School.
Ownership History
Date
Name
Owned For
Owner Type
Purchase Details
Closed on
Oct 27, 2020
Sold by
Cornish Marilyn
Bought by
Schmeckpeper Krista K and Schmeckpeper Douglas G
Current Estimated Value
Home Financials for this Owner
Home Financials are based on the most recent Mortgage that was taken out on this home.
Original Mortgage
$47,500
Outstanding Balance
$33,333
Interest Rate
2.8%
Mortgage Type
New Conventional
Estimated Equity
$104,270
Create a Home Valuation Report for This Property
The Home Valuation Report is an in-depth analysis detailing your home's value as well as a comparison with similar homes in the area
Purchase History
| Date | Buyer | Sale Price | Title Company |
|---|---|---|---|
| Schmeckpeper Krista K | $50,000 | Cedar Title & Escrow |
Source: Public Records
Mortgage History
| Date | Status | Borrower | Loan Amount |
|---|---|---|---|
| Open | Schmeckpeper Krista K | $47,500 |
Source: Public Records
Tax History
| Year | Tax Paid | Tax Assessment Tax Assessment Total Assessment is a certain percentage of the fair market value that is determined by local assessors to be the total taxable value of land and additions on the property. | Land | Improvement |
|---|---|---|---|---|
| 2025 | $1,558 | $134,040 | $17,385 | $116,655 |
| 2024 | $1,464 | $121,940 | $17,385 | $104,555 |
| 2023 | $1,464 | $101,780 | $17,385 | $84,395 |
| 2022 | $1,278 | $85,305 | $8,045 | $77,260 |
| 2021 | $1,241 | $81,895 | $8,045 | $73,850 |
| 2020 | $136 | $90,515 | $8,045 | $82,470 |
| 2019 | $236 | $90,515 | $8,045 | $82,470 |
| 2018 | $249 | $81,400 | $8,045 | $73,355 |
| 2017 | $267 | $79,540 | $6,185 | $73,355 |
| 2016 | $257 | $79,540 | $6,185 | $73,355 |
| 2015 | $270 | $75,635 | $4,950 | $70,685 |
| 2014 | $334 | $75,810 | $4,950 | $70,860 |
| 2013 | $262 | $68,030 | $4,950 | $63,080 |
Source: Public Records
Map
Nearby Homes
- 206 E Elm St
- 405 E Main St
- 109 Jay St
- 502 W Main St
- 200 E Roosevelt St
- 703 E Clark St
- 702 E Norris St
- 502 S Sherman St
- 708 E Grant St
- 88922 550th Ave
- 88952 550 Ave
- 312 Bazille St
- 609 W Omaha St
- 55310 Nebraska 121
- 1207 W 4th St
- 903 W 2nd St
- 315 W Colorado St
- 886 Rd Unit 532 Ave
- 55431 Highway 12
- See Legal Lot 303
Your Personal Tour Guide
Ask me questions while you tour the home.