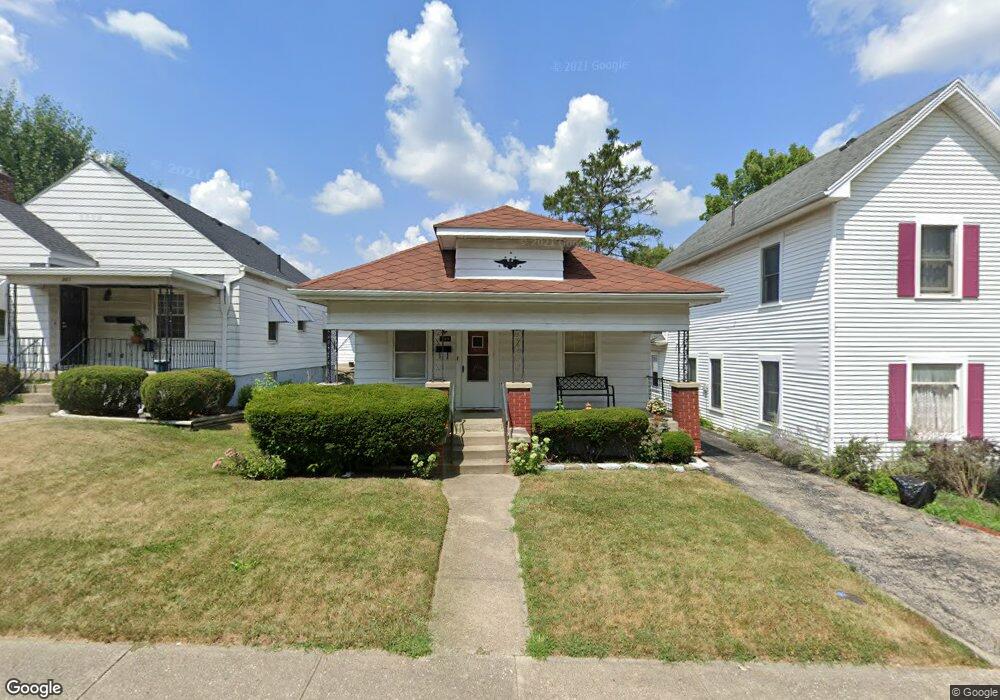
209 E Hillcrest Ave Dayton, OH 45405
North Riverdale NeighborhoodEstimated Value: $56,674 - $115,000
2
Beds
1
Bath
827
Sq Ft
$100/Sq Ft
Est. Value
About This Home
This home is located at 209 E Hillcrest Ave, Dayton, OH 45405 and is currently estimated at $82,919, approximately $100 per square foot. 209 E Hillcrest Ave is a home located in Montgomery County with nearby schools including Valerie Elementary School, Deca Prep, and Horizon Science Academy-Dayton Elementary School.
Ownership History
Date
Name
Owned For
Owner Type
Purchase Details
Closed on
Apr 29, 2022
Sold by
Roth Bruce C and Roth Rhonda L
Bought by
Bonilla Santos A
Current Estimated Value
Purchase Details
Closed on
Apr 11, 2008
Sold by
Deutsche Bank National Trust Co
Bought by
Roth Bruce C and Roth Rhonda L
Purchase Details
Closed on
Jul 18, 2007
Sold by
Jones John V and Jones Arlene
Bought by
Deutsche Bank National Trust Co and Morgan Stanley Abs Capital I Inc Trust 2
Purchase Details
Closed on
Mar 29, 2004
Sold by
Lawrence Laforest and Hoover Pamela R
Bought by
Jones John and Jones Arlene
Home Financials for this Owner
Home Financials are based on the most recent Mortgage that was taken out on this home.
Original Mortgage
$52,000
Interest Rate
5.66%
Mortgage Type
Purchase Money Mortgage
Purchase Details
Closed on
Jan 28, 1995
Sold by
Fisher Paul M and Fisher Virginia D
Bought by
Laforest Lawrence and Hoover Pamela R
Create a Home Valuation Report for This Property
The Home Valuation Report is an in-depth analysis detailing your home's value as well as a comparison with similar homes in the area
Home Values in the Area
Average Home Value in this Area
Purchase History
| Date | Buyer | Sale Price | Title Company |
|---|---|---|---|
| Bonilla Santos A | -- | Safemark Title | |
| Roth Bruce C | $11,000 | Nova Title Agency Inc | |
| Deutsche Bank National Trust Co | $48,000 | None Available | |
| Jones John | $65,000 | Titlequest Agency Inc | |
| Laforest Lawrence | -- | -- |
Source: Public Records
Mortgage History
| Date | Status | Borrower | Loan Amount |
|---|---|---|---|
| Previous Owner | Jones John | $52,000 |
Source: Public Records
Tax History Compared to Growth
Tax History
| Year | Tax Paid | Tax Assessment Tax Assessment Total Assessment is a certain percentage of the fair market value that is determined by local assessors to be the total taxable value of land and additions on the property. | Land | Improvement |
|---|---|---|---|---|
| 2024 | $773 | $13,170 | $4,100 | $9,070 |
| 2023 | $773 | $13,170 | $4,100 | $9,070 |
| 2022 | $712 | $9,610 | $2,990 | $6,620 |
| 2021 | $708 | $9,610 | $2,990 | $6,620 |
| 2020 | $707 | $9,610 | $2,990 | $6,620 |
| 2019 | $755 | $9,160 | $2,990 | $6,170 |
| 2018 | $756 | $9,160 | $2,990 | $6,170 |
| 2017 | $751 | $9,160 | $2,990 | $6,170 |
| 2016 | $881 | $10,310 | $2,990 | $7,320 |
| 2015 | $834 | $10,310 | $2,990 | $7,320 |
| 2014 | $834 | $10,310 | $2,990 | $7,320 |
| 2012 | -- | $15,130 | $4,450 | $10,680 |
Source: Public Records
Map
Nearby Homes
- 212 E Hillcrest Ave
- 212 E Beechwood Ave
- 324 E Maplewood Ave
- 156 E Hillcrest Ave
- 148 Basswood Ave
- 233 Pointview Ave
- 69 E Beechwood Ave
- 53 E Beechwood Ave
- 301 Fernwood Ave
- 326 Ernst Ave
- 2322 Theodore Ave
- 78 Pointview Ave
- 17 E Shadyside Dr
- 2324 Eastview Ave Unit 2322
- 29 Laura Ave
- 75 Pointview Ave
- 339 Knecht Dr
- 337 Knecht Dr
- 73 Pointview Ave
- 2313 Eastview Ave
- 201 E Hillcrest Ave
- 211 E Hillcrest Ave
- 217 E Hillcrest Ave
- 171 E Hillcrest Ave
- 304 E Maplewood Ave
- 308 E Maplewood Ave
- 300 E Maplewood Ave
- 312 E Maplewood Ave
- 219 E Hillcrest Ave
- 167 E Hillcrest Ave
- 206 E Hillcrest Ave
- 316 E Maplewood Ave
- 210 E Hillcrest Ave
- 202 E Hillcrest Ave
- 248 E Maplewood Ave
- 231 E Hillcrest Ave
- 161 E Hillcrest Ave
- 320 E Maplewood Ave
- 216 E Hillcrest Ave
- 242 E Maplewood Ave