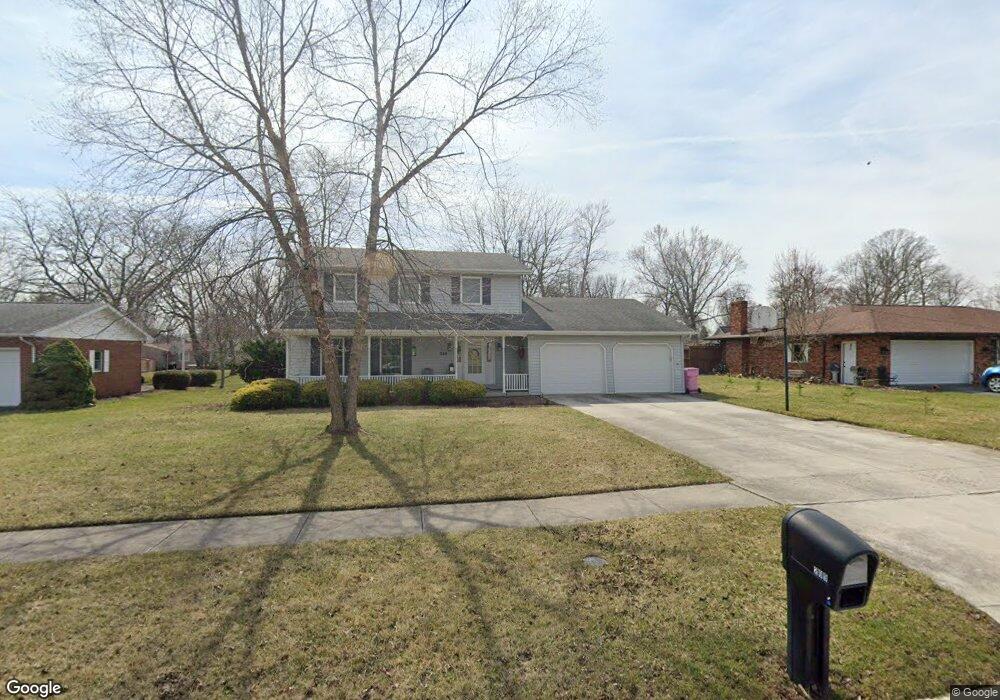
209 Hillshafer Dr Findlay, OH 45840
Estimated Value: $266,000 - $298,000
3
Beds
3
Baths
2,201
Sq Ft
$128/Sq Ft
Est. Value
About This Home
This home is located at 209 Hillshafer Dr, Findlay, OH 45840 and is currently estimated at $281,649, approximately $127 per square foot. 209 Hillshafer Dr is a home located in Hancock County with nearby schools including Bigelow Hill Elementary School, Northview Elementary School, and Glenwood Middle School.
Ownership History
Date
Name
Owned For
Owner Type
Purchase Details
Closed on
Apr 25, 2003
Sold by
Vogel Teresa A
Bought by
Ervin Timothy S and Ervin Lisa A
Current Estimated Value
Home Financials for this Owner
Home Financials are based on the most recent Mortgage that was taken out on this home.
Original Mortgage
$124,000
Interest Rate
5.86%
Mortgage Type
Purchase Money Mortgage
Purchase Details
Closed on
Mar 31, 1998
Sold by
Kobe Real Estate Inc
Bought by
Vogel Teresa
Home Financials for this Owner
Home Financials are based on the most recent Mortgage that was taken out on this home.
Original Mortgage
$106,400
Interest Rate
7.15%
Mortgage Type
New Conventional
Purchase Details
Closed on
Feb 4, 1992
Bought by
Kobe Real Estate Inc
Purchase Details
Closed on
Nov 21, 1983
Bought by
Anast Dennis E and Anast Vickie J
Purchase Details
Closed on
Mar 11, 1983
Bought by
Jaroush Ameen
Purchase Details
Closed on
Jan 14, 1982
Bought by
Croys Inc
Create a Home Valuation Report for This Property
The Home Valuation Report is an in-depth analysis detailing your home's value as well as a comparison with similar homes in the area
Home Values in the Area
Average Home Value in this Area
Purchase History
| Date | Buyer | Sale Price | Title Company |
|---|---|---|---|
| Ervin Timothy S | $155,000 | Golden Key Title | |
| Vogel Teresa | $133,000 | -- | |
| Kobe Real Estate Inc | $124,000 | -- | |
| Anast Dennis E | $11,900 | -- | |
| Jaroush Ameen | -- | -- | |
| Croys Inc | -- | -- |
Source: Public Records
Mortgage History
| Date | Status | Borrower | Loan Amount |
|---|---|---|---|
| Previous Owner | Ervin Timothy S | $124,000 | |
| Previous Owner | Vogel Teresa | $106,400 |
Source: Public Records
Tax History
| Year | Tax Paid | Tax Assessment Tax Assessment Total Assessment is a certain percentage of the fair market value that is determined by local assessors to be the total taxable value of land and additions on the property. | Land | Improvement |
|---|---|---|---|---|
| 2024 | $2,397 | $67,470 | $10,790 | $56,680 |
| 2023 | $2,401 | $67,470 | $10,790 | $56,680 |
| 2022 | $2,392 | $67,470 | $10,790 | $56,680 |
| 2021 | $2,432 | $59,740 | $10,370 | $49,370 |
| 2020 | $2,432 | $59,740 | $10,370 | $49,370 |
| 2019 | $2,383 | $59,740 | $10,370 | $49,370 |
| 2018 | $2,260 | $52,000 | $9,020 | $42,980 |
| 2017 | $2,261 | $52,000 | $9,020 | $42,980 |
| 2016 | $2,229 | $52,000 | $9,020 | $42,980 |
| 2015 | $2,283 | $52,200 | $9,020 | $43,180 |
| 2014 | $2,283 | $52,200 | $9,020 | $43,180 |
| 2012 | $2,299 | $52,200 | $9,020 | $43,180 |
Source: Public Records
Map
Nearby Homes
- 3315 Norcrest St
- 0 County Road 220 Lot 2
- 3105 Crosshill Dr
- 506 Hillcrest Ave
- 323 W Bigelow Ave
- 0 County Road 220 Lot 4
- 0 County Road 220 Unit 10004662
- 0 County Road 220 Lot 3
- 0 County Road 220 Unit 10004663
- 0 County Road 220 Unit 10004661
- 128 Harrington Ave
- 0 Township Highway 99
- 12325 Township Highway 99
- 2604 N Main St
- 2605 Eton Place
- 245 Edinborough Dr
- 400 Rosewood Ave
- 2400 Hollybrook Dr
- 2419 Hollybrook Dr
- 3237 Gleneagle Dr
- 201 Hillshafer Dr
- 217 Hillshafer Dr
- 208 Northcliff Dr
- 200 Northcliff Dr
- 216 Northcliff Dr
- 225 Hillshafer Dr
- 155 Hillshafer Dr
- 208 Hillshafer Dr
- 216 Hillshafer Dr
- 200 Hillshafer Dr
- 152 Northcliff Dr
- 224 Northcliff Dr
- 233 Hillshafer Dr
- 224 Hillshafer Dr
- 149 Hillshafer Dr
- 156 Hillshafer Dr
- 209 Northcliff Dr
- 201 Northcliff Dr
- 150 Hillshafer Dr Unit 148
- 150 Hillshafer Dr
Your Personal Tour Guide
Ask me questions while you tour the home.