
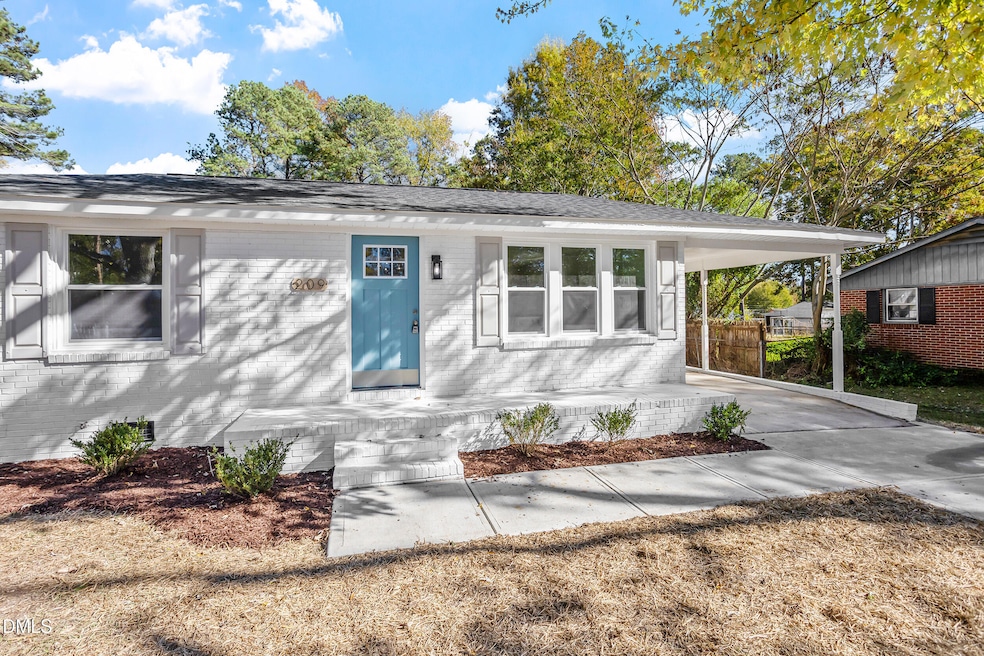
209 Lane of Sir Lancelot Garner, NC 27529
Estimated payment $1,633/month
Total Views
5,593
3
Beds
2
Baths
1,008
Sq Ft
$288
Price per Sq Ft
Highlights
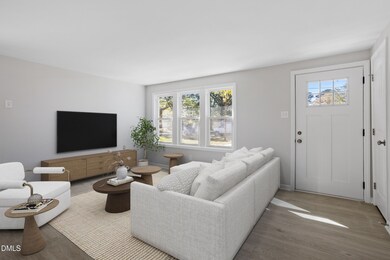
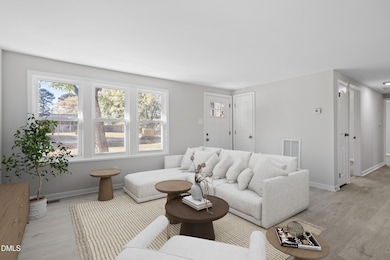
- Open Floorplan
- No HOA
- Front Porch
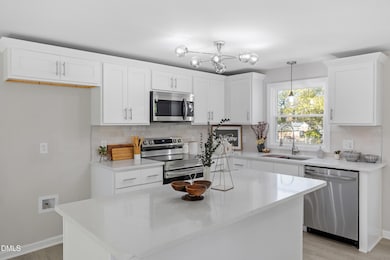
- Granite Countertops
- Stainless Steel Appliances
- Eat-In Kitchen
About This Home
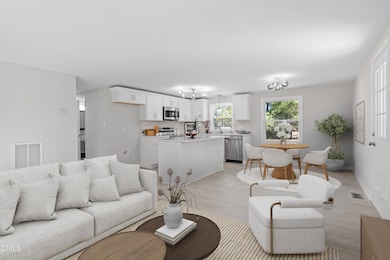
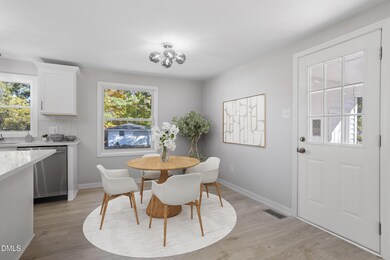
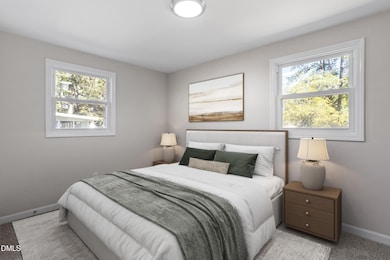
Cute as a button Ranch on large, flat lot with 2 car garage and upgrades galore! Wide plank hardwood laminate flooring throughout living areas; huge open floor plan with custom kitchen open to living spaces. Beautiful new shaker cabinets, granite countertops, glass tile backsplash and stainless steel appliances. Convenient location to White Oak Shopping, highways/bypass and charming Downtown Garner and Clayton. Staged photos for illustration only, to show homes potential.
Home Details
Home Type
- Single Family
Est. Annual Taxes
- $1,362
Year Built
- Built in 1966
Lot Details
- 0.35 Acre Lot
- Landscaped
Parking
- 2 Car Garage
- 1 Carport Space
- Gravel Driveway
- 2 Open Parking Spaces
Home Design
- Frame Construction
- Shingle Roof
Interior Spaces
- 1,008 Sq Ft Home
- 1-Story Property
- Open Floorplan
- Smooth Ceilings
- Ceiling Fan
- Family Room
- Dining Room
- Basement
- Crawl Space
- Laundry on main level
Kitchen
- Eat-In Kitchen
- Electric Range
- Microwave
- Dishwasher
- Stainless Steel Appliances
- Granite Countertops
Flooring
- Carpet
- Laminate
- Vinyl
Bedrooms and Bathrooms
- 3 Bedrooms
- 2 Full Bathrooms
- Double Vanity
- Bathtub with Shower
Outdoor Features
- Front Porch
Schools
- Creech Rd Elementary School
- East Garner Middle School
- South Garner High School
Utilities
- Forced Air Heating and Cooling System
- Water Heater
- Septic Tank
Community Details
- No Home Owners Association
- Camelot Subdivision
Listing and Financial Details
- Assessor Parcel Number 1730430065
Map
Create a Home Valuation Report for This Property
The Home Valuation Report is an in-depth analysis detailing your home's value as well as a comparison with similar homes in the area
Home Values in the Area
Average Home Value in this Area
Tax History
| Year | Tax Paid | Tax Assessment Tax Assessment Total Assessment is a certain percentage of the fair market value that is determined by local assessors to be the total taxable value of land and additions on the property. | Land | Improvement |
|---|---|---|---|---|
| 2025 | $1,362 | $209,742 | $100,000 | $109,742 |
| 2024 | $1,323 | $209,742 | $100,000 | $109,742 |
| 2023 | $1,058 | $133,152 | $42,000 | $91,152 |
| 2022 | $982 | $133,152 | $42,000 | $91,152 |
| 2021 | $956 | $133,152 | $42,000 | $91,152 |
| 2020 | $940 | $133,152 | $42,000 | $91,152 |
| 2019 | $706 | $83,971 | $36,000 | $47,971 |
| 2018 | $650 | $83,971 | $36,000 | $47,971 |
| 2017 | $617 | $83,971 | $36,000 | $47,971 |
| 2016 | $605 | $83,971 | $36,000 | $47,971 |
| 2015 | $200 | $99,973 | $38,000 | $61,973 |
| 2014 | -- | $99,973 | $38,000 | $61,973 |
Source: Public Records
Property History
| Date | Event | Price | List to Sale | Price per Sq Ft |
|---|---|---|---|---|
| 11/05/2025 11/05/25 | Pending | -- | -- | -- |
| 11/01/2025 11/01/25 | For Sale | $289,900 | -- | $288 / Sq Ft |
Source: Doorify MLS
Purchase History
| Date | Type | Sale Price | Title Company |
|---|---|---|---|
| Warranty Deed | $152,000 | Metro Title | |
| Warranty Deed | $152,000 | Metro Title | |
| Warranty Deed | $100,000 | None Listed On Document | |
| Warranty Deed | $100,000 | None Listed On Document | |
| Deed | $2,000 | -- |
Source: Public Records
Mortgage History
| Date | Status | Loan Amount | Loan Type |
|---|---|---|---|
| Open | $201,723 | Construction | |
| Closed | $201,723 | Construction |
Source: Public Records
About the Listing Agent
Stephanie is a professional REALTOR® who has a powerful combination of experience and education. Her career background includes mortgage banking, property investment, real estate sales and home staging. Her broad range of expertise enables her to serve a wide variety of clientele, in all market conditions.
Stephanie is a North Carolina native and East Carolina University alumni. She began her real estate career in 2004 when she purchased her first investment property. She continues to
Stephanie's Other Listings
Source: Doorify MLS
MLS Number: 10130913
APN: 1730.03-43-0065-000
Disclaimer: Certain information contained herein is derived from information provided by parties other than Homes.com. All information provided is deemed reliable, but is not guaranteed to be accurate and should be independently verified.
![]() Some IDX listings have been excluded from this IDX display. Brokers make an effort to deliver accurate information, but buyers should independently verify any information on which they will rely in a transaction. The listing broker shall not be responsible for any typographical errors, misinformation, or misprints, and they shall be held totally harmless from any damages arising from reliance upon this data. This data is provided exclusively for consumers’ personal, non-commercial use. Listings marked with an icon are provided courtesy of the Doorify MLS, Inc. of North Carolina, Internet Data Exchange Database. Closed (sold) listings may have been listed and/or sold by a real estate firm other than the firm(s) featured on this website. Closed data is not available until the sale of the property is recorded in the MLS. Home sale data is not an appraisal, CMA, competitive or comparative market analysis, or home valuation of any property. Copyright 2025 Doorify MLS, Inc. of North Carolina. All rights reserved.
Some IDX listings have been excluded from this IDX display. Brokers make an effort to deliver accurate information, but buyers should independently verify any information on which they will rely in a transaction. The listing broker shall not be responsible for any typographical errors, misinformation, or misprints, and they shall be held totally harmless from any damages arising from reliance upon this data. This data is provided exclusively for consumers’ personal, non-commercial use. Listings marked with an icon are provided courtesy of the Doorify MLS, Inc. of North Carolina, Internet Data Exchange Database. Closed (sold) listings may have been listed and/or sold by a real estate firm other than the firm(s) featured on this website. Closed data is not available until the sale of the property is recorded in the MLS. Home sale data is not an appraisal, CMA, competitive or comparative market analysis, or home valuation of any property. Copyright 2025 Doorify MLS, Inc. of North Carolina. All rights reserved.
Nearby Homes
- 209 King Arthur Trail
- 203 Lane of Sir Kay
- 1909 E Garner Rd
- 264 Meadowbark Bend Unit 43
- 272 Meadowbark Bend Unit 41
- 276 Meadowbark Bend Unit 40
- 280 Meadowbark Bend Unit 39
- 284 Meadowbark Bend Unit 38
- 288 Meadowbark Bend Unit 37
- 292 Meadowbark Bend Unit 36
- 296 Meadowbark Bend Unit 35
- Beckley Plan at Regency at Auburn Station - Discovery Collection
- Dilworth Plan at Regency at Auburn Station - Journey Collection
- Trawick Plan at Regency at Auburn Station - Journey Collection
- Tahoma Plan at Regency at Auburn Station - Excursion Collection
- Devin Plan at Regency at Auburn Station - Excursion Collection
- Mallard Plan at Regency at Auburn Station - Journey Collection
- Westview Plan at Regency at Auburn Station - Journey Collection
- Badin Plan at Regency at Auburn Station - Excursion Collection
- Hemsworth Plan at Regency at Auburn Station - Discovery Collection