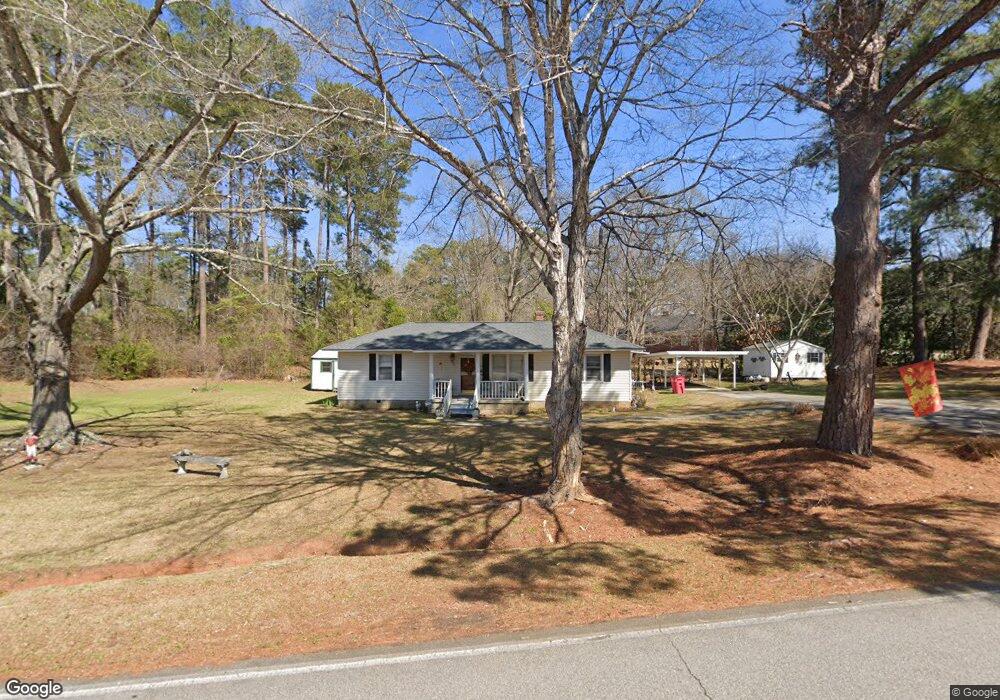
209 Lincoln Ave Lincolnton, GA 30817
Estimated Value: $133,000 - $182,000
2
Beds
2
Baths
969
Sq Ft
$169/Sq Ft
Est. Value
About This Home
This home is located at 209 Lincoln Ave, Lincolnton, GA 30817 and is currently estimated at $163,870, approximately $169 per square foot. 209 Lincoln Ave is a home located in Lincoln County with nearby schools including Lincoln County Elementary School, Lincoln County Middle School, and Lincoln County High School.
Ownership History
Date
Name
Owned For
Owner Type
Purchase Details
Closed on
Oct 15, 2025
Sold by
Kennedy James Robert
Bought by
Kennedy Barbara A
Current Estimated Value
Purchase Details
Closed on
Jun 22, 2007
Sold by
Rowland Abbe A
Bought by
Kennedy James R
Purchase Details
Closed on
Mar 6, 2006
Sold by
Farmers State Bank
Bought by
Rowland Abbe A
Purchase Details
Closed on
Jan 10, 2006
Sold by
Scott Joseph F
Bought by
Farmers State Bank
Purchase Details
Closed on
Sep 20, 2000
Sold by
Crook Verna M
Bought by
Scott Joseph F
Purchase Details
Closed on
Jun 6, 1996
Sold by
Crook John Lee
Bought by
Crook Verna M
Purchase Details
Closed on
Jan 31, 1995
Sold by
Crook Willie Mae and John Lee
Bought by
Crook John Lee
Purchase Details
Closed on
May 24, 1978
Sold by
Cryder R G
Bought by
Crook Willie Mae and John Lee
Purchase Details
Closed on
Mar 31, 1955
Sold by
Elam
Bought by
Cryder R G
Create a Home Valuation Report for This Property
The Home Valuation Report is an in-depth analysis detailing your home's value as well as a comparison with similar homes in the area
Home Values in the Area
Average Home Value in this Area
Purchase History
| Date | Buyer | Sale Price | Title Company |
|---|---|---|---|
| Kennedy Barbara A | -- | -- | |
| Kennedy James R | $89,000 | -- | |
| Rowland Abbe A | $50,000 | -- | |
| Farmers State Bank | -- | -- | |
| Scott Joseph F | $40,000 | -- | |
| Crook Verna M | -- | -- | |
| Crook John Lee | -- | -- | |
| Crook Willie Mae | $12,500 | -- | |
| Cryder R G | $500 | -- |
Source: Public Records
Mortgage History
| Date | Status | Borrower | Loan Amount |
|---|---|---|---|
| Closed | Rowland Abbe A | $0 |
Source: Public Records
Tax History Compared to Growth
Tax History
| Year | Tax Paid | Tax Assessment Tax Assessment Total Assessment is a certain percentage of the fair market value that is determined by local assessors to be the total taxable value of land and additions on the property. | Land | Improvement |
|---|---|---|---|---|
| 2025 | $1,241 | $47,912 | $2,040 | $45,872 |
| 2024 | $1,255 | $44,472 | $2,040 | $42,432 |
| 2023 | $387 | $39,124 | $2,040 | $37,084 |
| 2022 | $741 | $37,564 | $2,040 | $35,524 |
| 2021 | $732 | $34,320 | $2,040 | $32,280 |
| 2020 | $648 | $27,880 | $2,040 | $25,840 |
| 2019 | $651 | $27,880 | $2,040 | $25,840 |
| 2018 | $1,064 | $27,880 | $2,040 | $25,840 |
| 2017 | $954 | $24,976 | $4,400 | $20,576 |
| 2016 | $534 | $24,976 | $4,400 | $20,576 |
| 2015 | -- | $24,976 | $4,400 | $20,576 |
| 2014 | -- | $23,456 | $4,400 | $19,056 |
| 2013 | -- | $26,216 | $4,400 | $21,816 |
Source: Public Records
Map
Nearby Homes
- Lot 32 Eagle Point
- 0 Watson St
- Na Metasville Rd
- 118 Humphrey St
- 168 Ext Watson St
- 125 Goshen St
- 280 May Ave
- 202 Goshen St
- 570 Wallace-Wells Cir
- 125 Elm St
- 116 Jackie Way
- 00A Elberton Hwy
- LOT 4 Elberton Hwy
- Lot 3a Elberton Hwy
- 200 Cathy Way
- 1118 Augusta Hwy
- 00 C E Norman Rd
- 1460 Leathersville Rd
- Lot 32 Petersburg Place
- 32 Eagle Pointe