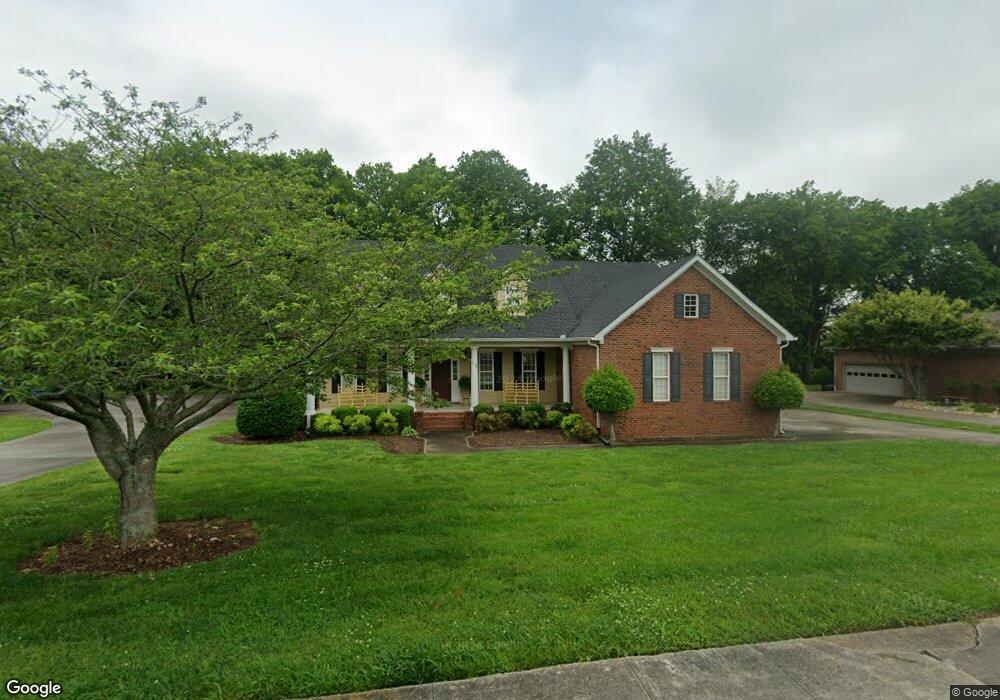
209 Megan Cir Shelbyville, TN 37160
Estimated Value: $420,148 - $644,000
--
Bed
3
Baths
3,373
Sq Ft
$159/Sq Ft
Est. Value
About This Home
This home is located at 209 Megan Cir, Shelbyville, TN 37160 and is currently estimated at $537,037, approximately $159 per square foot. 209 Megan Cir is a home located in Bedford County with nearby schools including East Side Elementary School, Harris Middle School, and Christian Chapel Academy.
Ownership History
Date
Name
Owned For
Owner Type
Purchase Details
Closed on
Oct 31, 2007
Sold by
Green James R
Bought by
Gambill John B
Current Estimated Value
Home Financials for this Owner
Home Financials are based on the most recent Mortgage that was taken out on this home.
Original Mortgage
$140,000
Outstanding Balance
$23,945
Interest Rate
6.26%
Estimated Equity
$513,092
Purchase Details
Closed on
Mar 31, 2006
Sold by
Bell Susan Neese
Bought by
Green James R
Home Financials for this Owner
Home Financials are based on the most recent Mortgage that was taken out on this home.
Original Mortgage
$194,400
Interest Rate
6.2%
Purchase Details
Closed on
Apr 10, 2002
Sold by
Cartwright Kenneth F
Bought by
Neese Susan
Purchase Details
Closed on
Dec 12, 2000
Sold by
City Of Shelbyville
Bought by
Cartwright Kenneth F
Purchase Details
Closed on
Aug 14, 1991
Bought by
Reed Floyd R and Reed Dorothy M
Purchase Details
Closed on
Aug 8, 1987
Bought by
Green Hills Ltd
Create a Home Valuation Report for This Property
The Home Valuation Report is an in-depth analysis detailing your home's value as well as a comparison with similar homes in the area
Home Values in the Area
Average Home Value in this Area
Purchase History
| Date | Buyer | Sale Price | Title Company |
|---|---|---|---|
| Gambill John B | $255,000 | -- | |
| Green James R | $243,000 | -- | |
| Neese Susan | $26,500 | -- | |
| Cartwright Kenneth F | $25,000 | -- | |
| Reed Floyd R | -- | -- | |
| Green Hills Ltd | -- | -- |
Source: Public Records
Mortgage History
| Date | Status | Borrower | Loan Amount |
|---|---|---|---|
| Open | Green Hills Ltd | $140,000 | |
| Previous Owner | Green Hills Ltd | $194,400 |
Source: Public Records
Tax History Compared to Growth
Tax History
| Year | Tax Paid | Tax Assessment Tax Assessment Total Assessment is a certain percentage of the fair market value that is determined by local assessors to be the total taxable value of land and additions on the property. | Land | Improvement |
|---|---|---|---|---|
| 2025 | -- | $86,875 | $0 | $0 |
| 2024 | -- | $86,875 | $9,450 | $77,425 |
| 2023 | $3,306 | $86,875 | $9,450 | $77,425 |
| 2022 | $3,401 | $86,875 | $9,450 | $77,425 |
| 2021 | $3,088 | $86,875 | $9,450 | $77,425 |
| 2020 | $2,844 | $86,875 | $9,450 | $77,425 |
| 2019 | $2,844 | $64,200 | $6,750 | $57,450 |
| 2018 | $2,780 | $64,200 | $6,750 | $57,450 |
| 2017 | $2,780 | $64,200 | $6,750 | $57,450 |
| 2016 | $2,754 | $64,200 | $6,750 | $57,450 |
| 2015 | $2,754 | $64,200 | $6,750 | $57,450 |
| 2014 | $2,361 | $60,221 | $0 | $0 |
Source: Public Records
Map
Nearby Homes
- 402 Rose Ln
- 223 Megan Cir
- 1030 Union St
- 407 Dow Dr
- 103 Laurelwood Dr
- 130 Horseshoe Dr
- 122 Laurelwood Dr
- 309 Honeysuckle Ln
- 1615 Elevation ABC Plan at Wheatfield
- 1567 Elevation ABC Plan at Wheatfield
- 410 Dover St
- 152 Demonbreum Cir
- 329 Dover St
- 106 Demonbreum Cir
- 107 Demonbreum Cir
- 110 Demonbreum Cir
- 111 Demonbreum Cir
- 102 Greystone Way
- 112 Demombreum Cir
- 100 Demombreum Cir
- 211 Megan Cir
- 207 Megan Cir
- 414 Dot Cir
- 208 Megan Cir
- 205 Megan Cir
- 213 Megan Cir
- 210 Megan Cir
- 203 Megan Cir
- 212 Megan Cir
- 102 Ava Way
- 210 Meadowbrook Dr
- 504 Rose Ln
- 512 Rose Ln
- 209 Meadowbrook Dr
- 211 Meadowbrook Dr
- 208 Meadowbrook Dr
- 205 Meadowbrook Dr
- 202 Meadowbrook Dr
- 1022 Union St
- 200 Megan Cir