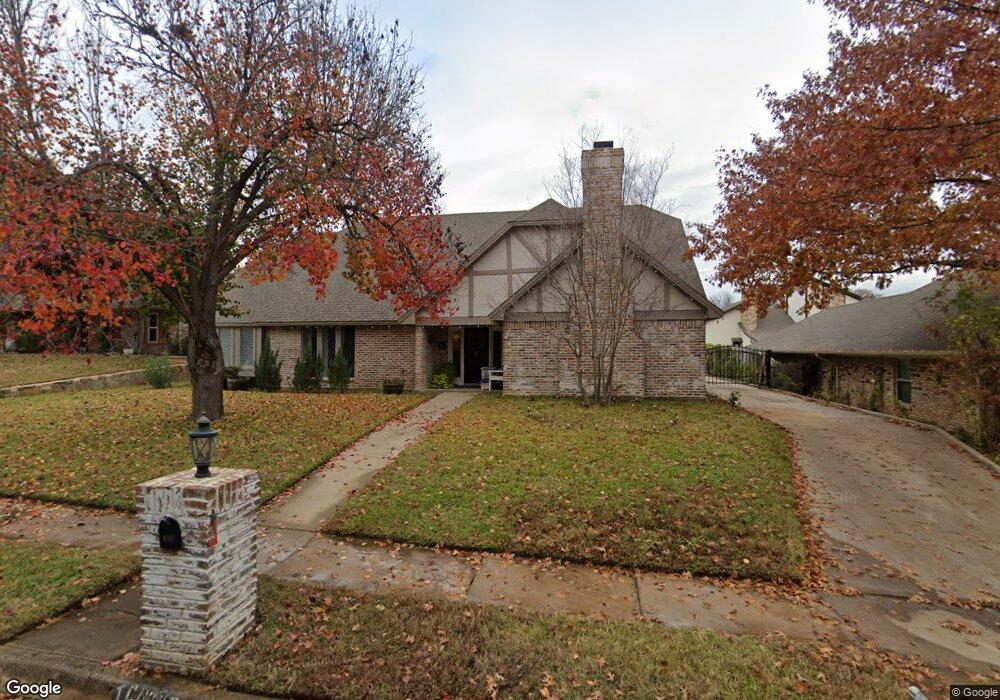
209 Pheasant Ct Bedford, TX 76021
Estimated Value: $509,000 - $594,800
4
Beds
4
Baths
2,918
Sq Ft
$188/Sq Ft
Est. Value
About This Home
This home is located at 209 Pheasant Ct, Bedford, TX 76021 and is currently estimated at $547,700, approximately $187 per square foot. 209 Pheasant Ct is a home located in Tarrant County with nearby schools including Bedford Heights Elementary School, Bedford Junior High School, and L.D. Bell High School.
Ownership History
Date
Name
Owned For
Owner Type
Purchase Details
Closed on
Feb 8, 2017
Sold by
Wilmiton Saving Fund Society Fsb
Bought by
Campbell Rick A and Campbell Roxana
Current Estimated Value
Home Financials for this Owner
Home Financials are based on the most recent Mortgage that was taken out on this home.
Original Mortgage
$222,400
Outstanding Balance
$184,086
Interest Rate
4.19%
Mortgage Type
New Conventional
Estimated Equity
$363,614
Purchase Details
Closed on
Feb 11, 2016
Sold by
Mathis Jimmy D and Buckley Melissa
Bought by
Wilmington Savings Fund Society Fsb and Christiana Trust
Purchase Details
Closed on
Apr 3, 2008
Sold by
Ivie Rufus A and Ivie Vivian
Bought by
Mathis Jimmy D and Buckley Melissa
Home Financials for this Owner
Home Financials are based on the most recent Mortgage that was taken out on this home.
Original Mortgage
$219,564
Interest Rate
6.19%
Mortgage Type
Purchase Money Mortgage
Purchase Details
Closed on
Nov 8, 1993
Sold by
Matte Mickey J and Matte Pauline E
Bought by
Ivie Rufus A and Ivie Vivian
Home Financials for this Owner
Home Financials are based on the most recent Mortgage that was taken out on this home.
Original Mortgage
$156,650
Interest Rate
7.71%
Create a Home Valuation Report for This Property
The Home Valuation Report is an in-depth analysis detailing your home's value as well as a comparison with similar homes in the area
Home Values in the Area
Average Home Value in this Area
Purchase History
| Date | Buyer | Sale Price | Title Company |
|---|---|---|---|
| Campbell Rick A | -- | None Available | |
| Wilmington Savings Fund Society Fsb | $309,810 | None Available | |
| Mathis Jimmy D | -- | Capital Title Of Tex | |
| Ivie Rufus A | -- | First American Title Co |
Source: Public Records
Mortgage History
| Date | Status | Borrower | Loan Amount |
|---|---|---|---|
| Open | Campbell Rick A | $222,400 | |
| Previous Owner | Mathis Jimmy D | $219,564 | |
| Previous Owner | Ivie Rufus A | $156,650 |
Source: Public Records
Tax History Compared to Growth
Tax History
| Year | Tax Paid | Tax Assessment Tax Assessment Total Assessment is a certain percentage of the fair market value that is determined by local assessors to be the total taxable value of land and additions on the property. | Land | Improvement |
|---|---|---|---|---|
| 2025 | $8,304 | $529,785 | $100,000 | $429,785 |
| 2024 | $8,304 | $529,785 | $100,000 | $429,785 |
| 2023 | $8,683 | $480,000 | $75,000 | $405,000 |
| 2022 | $8,989 | $411,557 | $75,000 | $336,557 |
| 2021 | $8,975 | $381,018 | $75,000 | $306,018 |
| 2020 | $8,394 | $353,028 | $75,000 | $278,028 |
| 2019 | $8,576 | $353,028 | $75,000 | $278,028 |
| 2018 | $8,978 | $369,544 | $75,000 | $294,544 |
| 2017 | $6,725 | $278,000 | $45,000 | $233,000 |
| 2016 | $7,480 | $309,221 | $45,000 | $264,221 |
| 2015 | $6,155 | $245,100 | $26,000 | $219,100 |
| 2014 | $6,155 | $245,100 | $26,000 | $219,100 |
Source: Public Records
Map
Nearby Homes
- 320 Blue Quail Ct
- 305 Warbler Dr
- 405 Woodbriar Ct
- 404 Heather Ln
- 432 Sunnybrook Ct
- 3213 Spring Valley Dr
- 3713 Brentwood Ct
- 2212 Mountainview Dr
- 3605 Spring Valley Dr
- 2244 Hurstview Dr
- 2212 Hurstview Dr
- 3119 Spring Grove Dr
- 2620 Brookridge Dr
- 421 Cavender Ct
- 121 Kay Ct
- 628 Huntwich Dr
- 801 Shady Creek Ln
- 913 Kensington Ct
- 124 Jeannie Ct
- 3609 Wayne Ct
- 213 Pheasant Ct
- 205 Pheasant Ct
- 212 Eagle Ct
- 208 Eagle Ct
- 216 Eagle Ct
- 217 Pheasant Ct
- 212 Pheasant Ct
- 216 Pheasant Ct
- 201 Pheasant Ct
- 220 Eagle Ct
- 208 Pheasant Ct
- 204 Eagle Ct
- 220 Pheasant Ct
- 221 Pheasant Ct
- 200 Pheasant Ct
- 204 Pheasant Ct
- 224 Eagle Ct
- 209 Eagle Ct
- 3233 Blue Quail Ln
- 3113 Shenandoah Dr