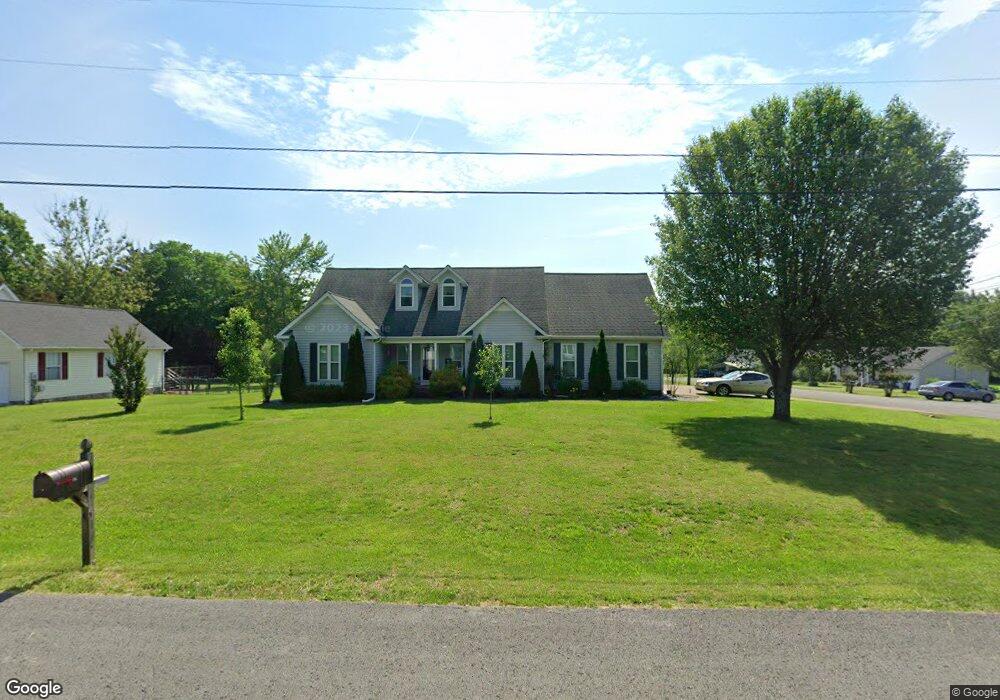
209 Russell St Shelbyville, TN 37160
Estimated Value: $270,550 - $336,000
--
Bed
2
Baths
1,657
Sq Ft
$189/Sq Ft
Est. Value
About This Home
This home is located at 209 Russell St, Shelbyville, TN 37160 and is currently estimated at $312,638, approximately $188 per square foot. 209 Russell St is a home located in Bedford County with nearby schools including South Side Elementary School, Harris Middle School, and Christian Chapel Academy.
Ownership History
Date
Name
Owned For
Owner Type
Purchase Details
Closed on
Jul 15, 2017
Sold by
Isbell Mark A and Isbell Trina
Bought by
Isbell Mark Allen and Isbell Trina
Current Estimated Value
Home Financials for this Owner
Home Financials are based on the most recent Mortgage that was taken out on this home.
Original Mortgage
$174,060
Outstanding Balance
$144,263
Interest Rate
3.89%
Mortgage Type
VA
Estimated Equity
$168,375
Purchase Details
Closed on
Jun 20, 1996
Sold by
Warren Gordon
Bought by
Isbell Mark and Isbell Trina
Home Financials for this Owner
Home Financials are based on the most recent Mortgage that was taken out on this home.
Original Mortgage
$88,650
Interest Rate
7.99%
Purchase Details
Closed on
Sep 28, 1995
Sold by
Carlton Bell H
Bought by
Warren Gordon
Purchase Details
Closed on
Dec 24, 1986
Bought by
Elbert Bell H and Elbert Landers
Create a Home Valuation Report for This Property
The Home Valuation Report is an in-depth analysis detailing your home's value as well as a comparison with similar homes in the area
Home Values in the Area
Average Home Value in this Area
Purchase History
| Date | Buyer | Sale Price | Title Company |
|---|---|---|---|
| Isbell Mark Allen | -- | None Available | |
| Isbell Mark | $98,500 | -- | |
| Warren Gordon | $10,000 | -- | |
| Elbert Bell H | $25,000 | -- |
Source: Public Records
Mortgage History
| Date | Status | Borrower | Loan Amount |
|---|---|---|---|
| Open | Isbell Mark Allen | $174,060 | |
| Closed | Elbert Bell H | $88,650 |
Source: Public Records
Tax History Compared to Growth
Tax History
| Year | Tax Paid | Tax Assessment Tax Assessment Total Assessment is a certain percentage of the fair market value that is determined by local assessors to be the total taxable value of land and additions on the property. | Land | Improvement |
|---|---|---|---|---|
| 2025 | -- | $44,850 | $0 | $0 |
| 2024 | -- | $44,850 | $7,750 | $37,100 |
| 2023 | $1,707 | $44,850 | $7,750 | $37,100 |
| 2022 | $1,756 | $44,850 | $7,750 | $37,100 |
| 2021 | $1,594 | $44,850 | $7,750 | $37,100 |
| 2020 | $1,328 | $44,850 | $7,750 | $37,100 |
| 2019 | $1,328 | $29,975 | $5,750 | $24,225 |
| 2018 | $1,298 | $29,975 | $5,750 | $24,225 |
| 2017 | $1,298 | $29,975 | $5,750 | $24,225 |
| 2016 | $1,286 | $29,975 | $5,750 | $24,225 |
| 2015 | $1,286 | $29,975 | $5,750 | $24,225 |
| 2014 | $1,117 | $28,493 | $0 | $0 |
Source: Public Records
Map
Nearby Homes
- 207 Russell St
- 301 Russell St
- 205 Russell St
- 103 Brookhaven Cove
- 102 Brookhaven Cove
- 208 Russell St
- 105 Brookhaven Cove
- 303 Russell St
- 300 Russell St
- 204 Russell St
- 104 Brookhaven Cove
- 305 Russell St
- 202 Russell St
- 302 Russell St
- 203 Russell St
- 304 Russell St
- 201 Russell St
- 114 White Dr
- 112 White Dr
- 112 Lantern Ln