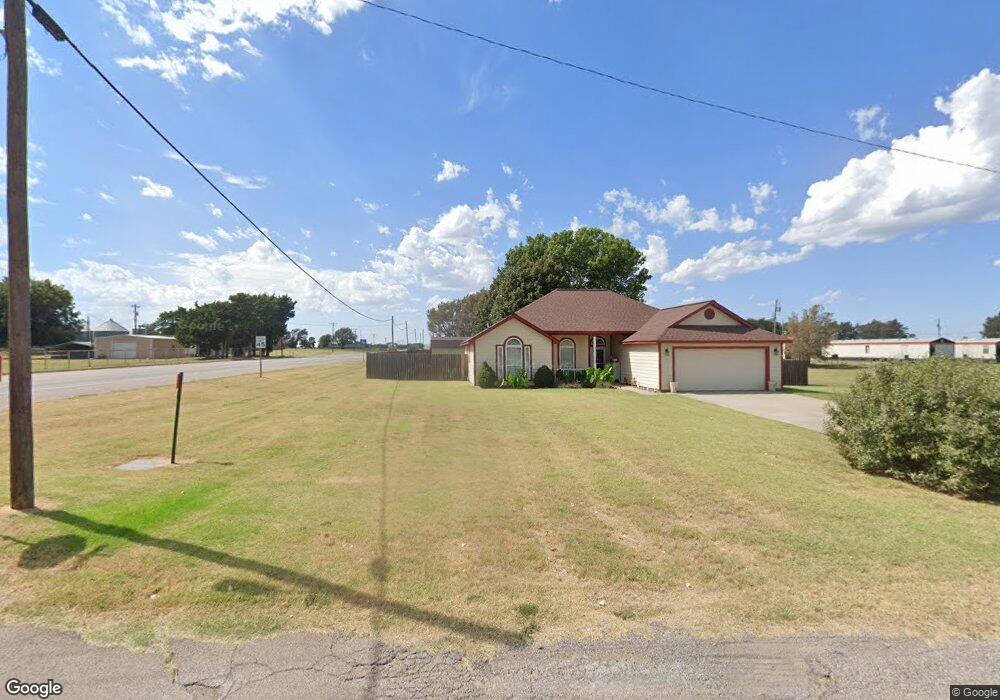
209 S Cedar St Seiling, OK 73663
Estimated Value: $209,000 - $285,000
3
Beds
2
Baths
1,504
Sq Ft
$159/Sq Ft
Est. Value
About This Home
This home is located at 209 S Cedar St, Seiling, OK 73663 and is currently estimated at $239,288, approximately $159 per square foot. 209 S Cedar St is a home with nearby schools including Seiling Elementary School, Seiling Junior High School, and Seiling Senior High School.
Ownership History
Date
Name
Owned For
Owner Type
Purchase Details
Closed on
Jun 29, 2022
Sold by
Fisher Christopher and Fisher Brandi
Bought by
Sander Julia L
Current Estimated Value
Purchase Details
Closed on
Dec 28, 2018
Sold by
Gore and Stacy
Bought by
Fisher Christopher and Fisher Brandi
Home Financials for this Owner
Home Financials are based on the most recent Mortgage that was taken out on this home.
Original Mortgage
$189,150
Interest Rate
4.8%
Mortgage Type
Construction
Purchase Details
Closed on
Sep 25, 2015
Sold by
Gore Construction Llc
Bought by
Gore Aaron
Purchase Details
Closed on
Jun 3, 2014
Sold by
Whetstone Randy and Whetstone Christ
Bought by
Gore Construction Llc
Purchase Details
Closed on
Oct 11, 2012
Sold by
Goldston Charles R and Goldston Jan
Bought by
Whetstone Randy and Whetstone Christ
Create a Home Valuation Report for This Property
The Home Valuation Report is an in-depth analysis detailing your home's value as well as a comparison with similar homes in the area
Home Values in the Area
Average Home Value in this Area
Purchase History
| Date | Buyer | Sale Price | Title Company |
|---|---|---|---|
| Sander Julia L | $220,000 | Woodward Cnty Abstract Co | |
| Fisher Christopher | $195,000 | Woodward Cnty Abstract Co | |
| Gore Aaron | $208,000 | -- | |
| Gore Construction Llc | $13,500 | -- | |
| Whetstone Randy | $12,500 | -- |
Source: Public Records
Mortgage History
| Date | Status | Borrower | Loan Amount |
|---|---|---|---|
| Previous Owner | Fisher Christopher | $189,150 |
Source: Public Records
Tax History Compared to Growth
Tax History
| Year | Tax Paid | Tax Assessment Tax Assessment Total Assessment is a certain percentage of the fair market value that is determined by local assessors to be the total taxable value of land and additions on the property. | Land | Improvement |
|---|---|---|---|---|
| 2025 | $2,220 | $25,254 | $2,587 | $22,667 |
| 2024 | $2,220 | $26,354 | $1,847 | $24,507 |
| 2023 | $1,860 | $24,248 | $1,848 | $22,400 |
| 2022 | $1,634 | $18,953 | $1,848 | $17,105 |
| 2021 | $1,518 | $18,051 | $1,848 | $16,203 |
| 2020 | $1,451 | $18,051 | $1,848 | $16,203 |
| 2019 | $1,730 | $21,450 | $1,694 | $19,756 |
| 2018 | $1,380 | $17,703 | $1,386 | $16,317 |
| 2017 | $1,483 | $17,991 | $1,409 | $16,582 |
| 2016 | $1,383 | $22,879 | $1,409 | $21,470 |
| 2015 | $1,151 | $17,736 | $110 | $17,626 |
| 2014 | $7 | $110 | $110 | $0 |
Source: Public Records
Map
Nearby Homes
- 305 W 1st St
- 501 N Cedar St
- 107 N Locust St
- 504 N Walnut St
- 520 N Locust St
- 825 NW Highway 270
- 610 N Locust St
- 1404 N Oak
- 1409 N Oak
- 1408 N Oak
- 307 County Line Rd
- 236198 E County Road 58
- 46864 U S 270
- 114 E Hamar Ave
- 114 Francis St
- E 0560 Rd
- 000 E 0560 Rd -160 Acres
- 0 Boatramp Rd Unit 1073816
- Rr Jennyville Rd
- Rr Putnam Ok
- 501 W Shepherd St
- 226363 Us Highway 60
- 206 S Cottonwood St
- 204 S Cottonwood St
- 200 Cottonwood St
- 425 Louisville Aly
- 106 S Cottonwood St
- 102 S Cottonwood St
- 211 S Orange St
- 205 S Orange St
- 201 S Orange St
- 102 Cottonwood St
- 320 S Bonine St
- 100 S Cottonwood St
- 105 N Cedar St
- 103 S Orange St
- 101 S Orange St
- 100 N Cottonwood St
- 623 W Shepherd St
- 110 S Orange St