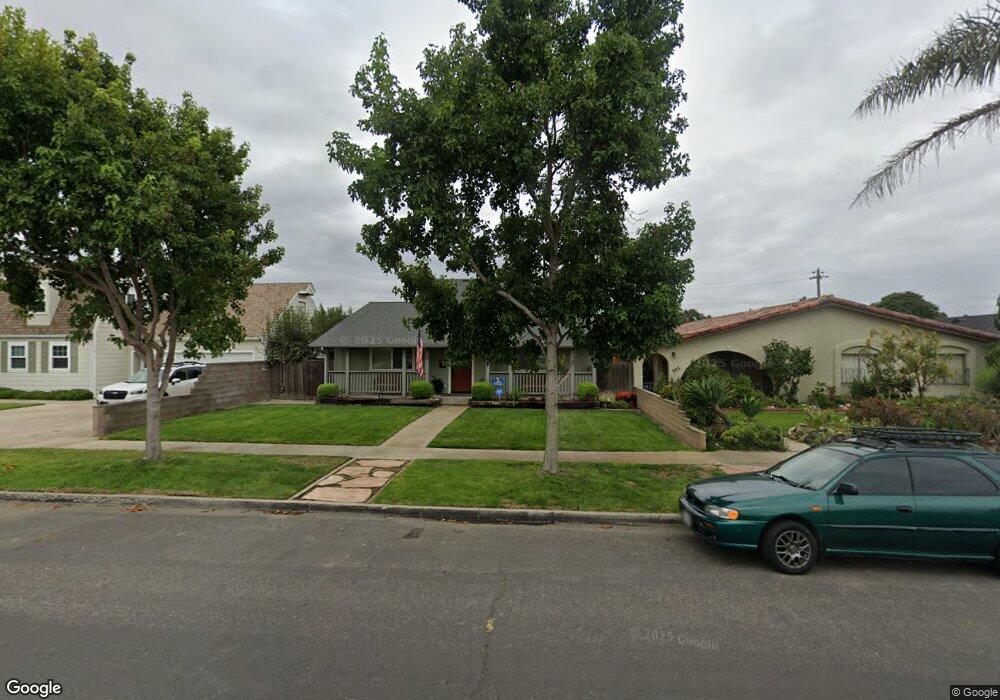
209 S E St Lompoc, CA 93436
Estimated Value: $534,000 - $723,000
2
Beds
1
Bath
2,246
Sq Ft
$291/Sq Ft
Est. Value
About This Home
This home is located at 209 S E St, Lompoc, CA 93436 and is currently estimated at $652,757, approximately $290 per square foot. 209 S E St is a home located in Santa Barbara County with nearby schools including Arthur Hapgood Elementary School, Lompoc Valley Middle School, and Lompoc High School.
Ownership History
Date
Name
Owned For
Owner Type
Purchase Details
Closed on
Jan 31, 2025
Sold by
Clark Brian D and Clark Heidi L
Bought by
Hb Clark Family Trust and Clark
Current Estimated Value
Purchase Details
Closed on
May 5, 2005
Sold by
Fitzpatrick Michael A and Fitzpatrick Mary
Bought by
Clark Brian D and Clark Heidi L
Home Financials for this Owner
Home Financials are based on the most recent Mortgage that was taken out on this home.
Original Mortgage
$34,500
Interest Rate
5.72%
Mortgage Type
Credit Line Revolving
Create a Home Valuation Report for This Property
The Home Valuation Report is an in-depth analysis detailing your home's value as well as a comparison with similar homes in the area
Home Values in the Area
Average Home Value in this Area
Purchase History
| Date | Buyer | Sale Price | Title Company |
|---|---|---|---|
| Hb Clark Family Trust | -- | None Listed On Document | |
| Clark Brian D | -- | None Listed On Document | |
| Clark Brian D | $345,000 | Fidelity National Title |
Source: Public Records
Mortgage History
| Date | Status | Borrower | Loan Amount |
|---|---|---|---|
| Previous Owner | Clark Brian D | $34,500 | |
| Previous Owner | Clark Brian D | $276,000 |
Source: Public Records
Tax History
| Year | Tax Paid | Tax Assessment Tax Assessment Total Assessment is a certain percentage of the fair market value that is determined by local assessors to be the total taxable value of land and additions on the property. | Land | Improvement |
|---|---|---|---|---|
| 2025 | $5,515 | $531,000 | $207,000 | $324,000 |
| 2023 | $5,515 | $458,000 | $179,000 | $279,000 |
| 2022 | $5,020 | $449,000 | $175,000 | $274,000 |
| 2021 | $4,492 | $390,000 | $152,000 | $238,000 |
| 2020 | $4,072 | $354,000 | $138,000 | $216,000 |
| 2019 | $4,003 | $347,000 | $135,000 | $212,000 |
| 2018 | $2,768 | $240,000 | $129,000 | $111,000 |
| 2017 | $2,643 | $229,000 | $123,000 | $106,000 |
| 2016 | $2,400 | $208,000 | $112,000 | $96,000 |
| 2014 | $2,098 | $180,000 | $97,000 | $83,000 |
Source: Public Records
Map
Nearby Homes
Your Personal Tour Guide
Ask me questions while you tour the home.