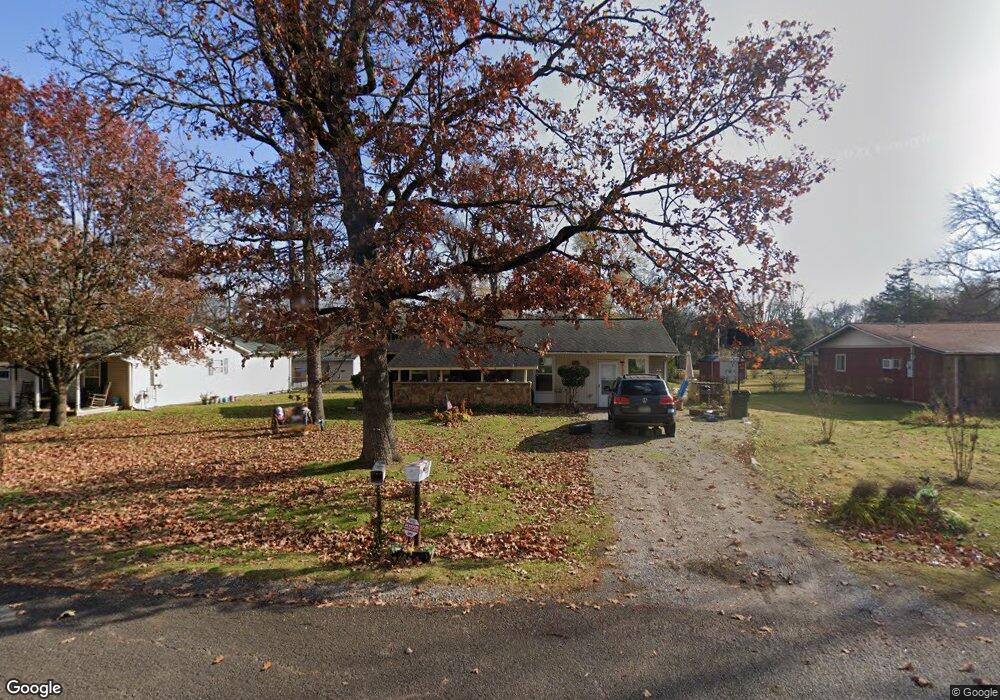
209 Shelby St Fort Oglethorpe, GA 30742
Estimated Value: $200,306 - $207,000
--
Bed
1
Bath
1,245
Sq Ft
$163/Sq Ft
Est. Value
About This Home
This home is located at 209 Shelby St, Fort Oglethorpe, GA 30742 and is currently estimated at $203,327, approximately $163 per square foot. 209 Shelby St is a home located in Catoosa County with nearby schools including Battlefield Primary School, Battlefield Elementary School, and Lakeview Middle School.
Ownership History
Date
Name
Owned For
Owner Type
Purchase Details
Closed on
Mar 22, 2023
Sold by
Ackerly Karen L
Bought by
Kain Development Llc
Current Estimated Value
Home Financials for this Owner
Home Financials are based on the most recent Mortgage that was taken out on this home.
Original Mortgage
$131,432
Outstanding Balance
$71,029
Interest Rate
6.5%
Mortgage Type
Mortgage Modification
Estimated Equity
$132,298
Purchase Details
Closed on
May 9, 2013
Sold by
Templeton Walter
Bought by
Templeton Walter
Purchase Details
Closed on
Apr 21, 1998
Sold by
Templeton Majel S and Ackerly Ka
Bought by
Ackerly Karen L
Create a Home Valuation Report for This Property
The Home Valuation Report is an in-depth analysis detailing your home's value as well as a comparison with similar homes in the area
Home Values in the Area
Average Home Value in this Area
Purchase History
| Date | Buyer | Sale Price | Title Company |
|---|---|---|---|
| Kain Development Llc | $188,000 | -- | |
| Templeton Walter | -- | -- | |
| Ackerly Karen L | -- | -- |
Source: Public Records
Mortgage History
| Date | Status | Borrower | Loan Amount |
|---|---|---|---|
| Open | Kain Development Llc | $131,432 |
Source: Public Records
Tax History Compared to Growth
Tax History
| Year | Tax Paid | Tax Assessment Tax Assessment Total Assessment is a certain percentage of the fair market value that is determined by local assessors to be the total taxable value of land and additions on the property. | Land | Improvement |
|---|---|---|---|---|
| 2024 | $1,767 | $67,157 | $7,920 | $59,237 |
| 2023 | $1,348 | $47,987 | $7,920 | $40,067 |
| 2022 | $1,038 | $36,952 | $7,920 | $29,032 |
| 2021 | $984 | $36,952 | $7,920 | $29,032 |
| 2020 | $953 | $32,273 | $7,920 | $24,353 |
| 2019 | $963 | $32,273 | $7,920 | $24,353 |
| 2018 | $757 | $24,156 | $7,040 | $17,116 |
| 2017 | $758 | $24,185 | $7,040 | $17,145 |
| 2016 | $740 | $22,592 | $7,040 | $15,552 |
| 2015 | -- | $22,592 | $7,040 | $15,552 |
| 2014 | -- | $22,592 | $7,040 | $15,552 |
| 2013 | -- | $22,592 | $7,040 | $15,552 |
Source: Public Records
Map
Nearby Homes