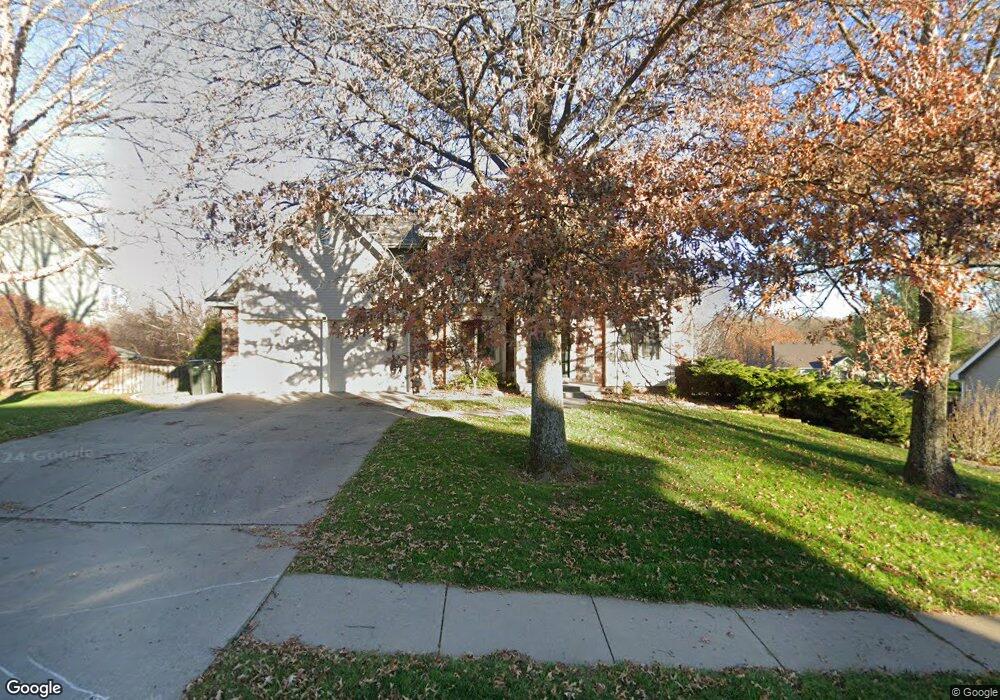
209 Southfork Rd Lansing, KS 66043
Estimated Value: $457,000 - $476,000
4
Beds
4
Baths
2,984
Sq Ft
$158/Sq Ft
Est. Value
About This Home
This home is located at 209 Southfork Rd, Lansing, KS 66043 and is currently estimated at $470,341, approximately $157 per square foot. 209 Southfork Rd is a home located in Leavenworth County with nearby schools including Lansing Elementary School, Lansing Middle 6-8, and Lansing High 9-12.
Ownership History
Date
Name
Owned For
Owner Type
Purchase Details
Closed on
Jun 1, 1994
Bought by
Cruce Charles F and Cruce Denise D
Current Estimated Value
Home Financials for this Owner
Home Financials are based on the most recent Mortgage that was taken out on this home.
Original Mortgage
$247,000
Outstanding Balance
$196,821
Interest Rate
8.53%
Mortgage Type
New Conventional
Estimated Equity
$273,520
Create a Home Valuation Report for This Property
The Home Valuation Report is an in-depth analysis detailing your home's value as well as a comparison with similar homes in the area
Home Values in the Area
Average Home Value in this Area
Purchase History
| Date | Buyer | Sale Price | Title Company |
|---|---|---|---|
| Cruce Charles F | $26,500 | -- |
Source: Public Records
Mortgage History
| Date | Status | Borrower | Loan Amount |
|---|---|---|---|
| Open | Cruce Charles F | $247,000 | |
| Closed | Cruce Charles F | $221,880 |
Source: Public Records
Tax History
| Year | Tax Paid | Tax Assessment Tax Assessment Total Assessment is a certain percentage of the fair market value that is determined by local assessors to be the total taxable value of land and additions on the property. | Land | Improvement |
|---|---|---|---|---|
| 2025 | $6,683 | $51,237 | $6,811 | $44,426 |
| 2024 | $6,434 | $49,266 | $6,811 | $42,455 |
| 2023 | $6,434 | $49,266 | $6,811 | $42,455 |
| 2022 | $5,971 | $43,252 | $6,468 | $36,784 |
| 2021 | $5,980 | $41,412 | $6,468 | $34,944 |
| 2020 | $5,735 | $39,089 | $6,468 | $32,621 |
| 2019 | $5,502 | $37,463 | $6,468 | $30,995 |
| 2018 | $5,500 | $37,463 | $6,468 | $30,995 |
| 2017 | $5,321 | $36,176 | $6,468 | $29,708 |
| 2016 | $5,324 | $36,176 | $6,468 | $29,708 |
| 2015 | $5,308 | $36,176 | $6,468 | $29,708 |
| 2014 | $5,200 | $36,176 | $6,468 | $29,708 |
Source: Public Records
Map
Nearby Homes
- 189 Canyon View Dr
- 111 Southfork Rd
- 875 Clearview Dr
- 1322 Rock Creek Ct
- 898 Clearview Dr
- 1221 S Desoto Rd
- 24431 139th St
- 13965 Mc Intyre Rd
- 922 Southfork St
- 13788 McIntyre1 Rd
- 13788 Mcintyre Rd
- 13788 McIntyre2 Rd
- 811 4-H Rd
- 26731 147th St
- 202 S Main St
- 124 S Main St
- 218 E Kay St
- 130 Hampton Ct
- 15683 Gilman Rd
- 20958 Ida St
- 207 Southfork Rd
- 211 Southfork Rd
- 187 Canyon View Dr
- 205 Southfork Rd
- 208 Southfork Rd
- 206 Southfork Rd
- 191 Canyon View Dr
- 185 Canyon View Dr
- 204 Southfork Rd
- 210 Southfork Rd
- 181 Canyon View Dr
- 183 Canyon View Dr
- 203 Southfork Rd
- 202 Southfork Rd
- 195 Canyon View Dr
- 197 Canyon View Dr
- 200 Cottonwood Dr
- 180 Canyon View Dr
- 182 Canyon View Dr
Your Personal Tour Guide
Ask me questions while you tour the home.