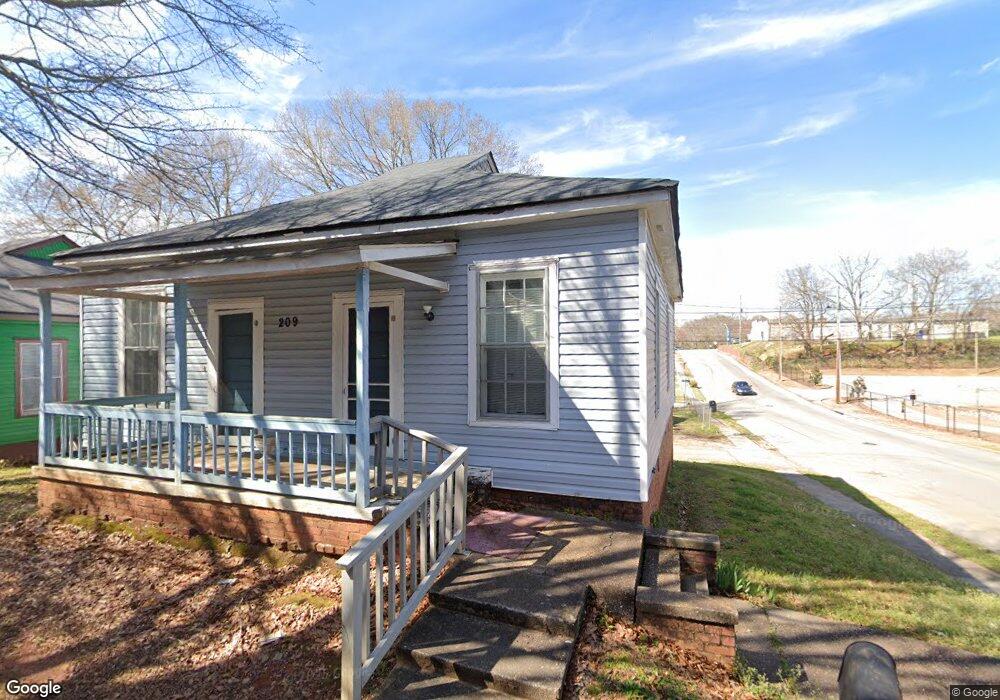
209 Vine St Lagrange, GA 30241
Estimated Value: $87,000 - $105,000
3
Beds
1
Bath
1,216
Sq Ft
$78/Sq Ft
Est. Value
About This Home
This home is located at 209 Vine St, Lagrange, GA 30241 and is currently estimated at $94,664, approximately $77 per square foot. 209 Vine St is a home located in Troup County with nearby schools including Hollis Hand Elementary School, Franklin Forest Elementary School, and Ethel W. Kight Elementary School.
Ownership History
Date
Name
Owned For
Owner Type
Purchase Details
Closed on
Jun 18, 2021
Sold by
Sheppard Lee Anna
Bought by
Jennings Shakenna D
Current Estimated Value
Purchase Details
Closed on
Jul 29, 1999
Sold by
Lee Anna Talley
Bought by
Sheppard Lee Ann
Purchase Details
Closed on
Dec 23, 1998
Sold by
Neighborhood Housing
Bought by
Lee Anna Talley
Purchase Details
Closed on
Dec 20, 1998
Sold by
Hardy P
Bought by
Neighborhood Housing
Purchase Details
Closed on
Jun 30, 1997
Sold by
Charles Jerry Willis
Bought by
Hardy P
Purchase Details
Closed on
Nov 2, 1990
Sold by
Averett Jerry C
Bought by
Charles Jerry Willis
Purchase Details
Closed on
Mar 4, 1982
Sold by
Jones Rachel M and Alice Fletch
Bought by
Averett Jerry C
Purchase Details
Closed on
Jan 27, 1979
Sold by
Mallory Georgia Hammett
Bought by
Jones Rachel M and Alice Fletch
Purchase Details
Closed on
Dec 29, 1978
Sold by
Mallory Realty
Bought by
Mallory Georgia Hammett
Purchase Details
Closed on
Jan 1, 1964
Sold by
Anderson C O
Bought by
Mallory Realty
Create a Home Valuation Report for This Property
The Home Valuation Report is an in-depth analysis detailing your home's value as well as a comparison with similar homes in the area
Purchase History
| Date | Buyer | Sale Price | Title Company |
|---|---|---|---|
| Jennings Shakenna D | -- | -- | |
| Sheppard Lee Ann | -- | -- | |
| Lee Anna Talley | $52,400 | -- | |
| Neighborhood Housing | -- | -- | |
| Hardy P | $30,000 | -- | |
| Charles Jerry Willis | $18,000 | -- | |
| Averett Jerry C | -- | -- | |
| Jones Rachel M | -- | -- | |
| Mallory Georgia Hammett | -- | -- | |
| Mallory Realty | -- | -- |
Source: Public Records
Tax History
| Year | Tax Paid | Tax Assessment Tax Assessment Total Assessment is a certain percentage of the fair market value that is determined by local assessors to be the total taxable value of land and additions on the property. | Land | Improvement |
|---|---|---|---|---|
| 2025 | $728 | $26,680 | $2,360 | $24,320 |
| 2024 | $649 | $23,800 | $2,360 | $21,440 |
| 2023 | $461 | $16,920 | $2,360 | $14,560 |
| 2022 | $449 | $16,080 | $2,360 | $13,720 |
| 2021 | $401 | $15,280 | $760 | $14,520 |
| 2020 | $401 | $15,280 | $760 | $14,520 |
| 2019 | $370 | $14,272 | $832 | $13,440 |
| 2018 | $370 | $14,272 | $832 | $13,440 |
| 2017 | $371 | $14,272 | $832 | $13,440 |
| 2016 | $365 | $14,078 | $832 | $13,246 |
| 2015 | $366 | $14,078 | $832 | $13,246 |
| 2014 | $400 | $15,188 | $832 | $14,356 |
| 2013 | -- | $16,512 | $832 | $15,680 |
Source: Public Records
Map
Nearby Homes
Your Personal Tour Guide
Ask me questions while you tour the home.