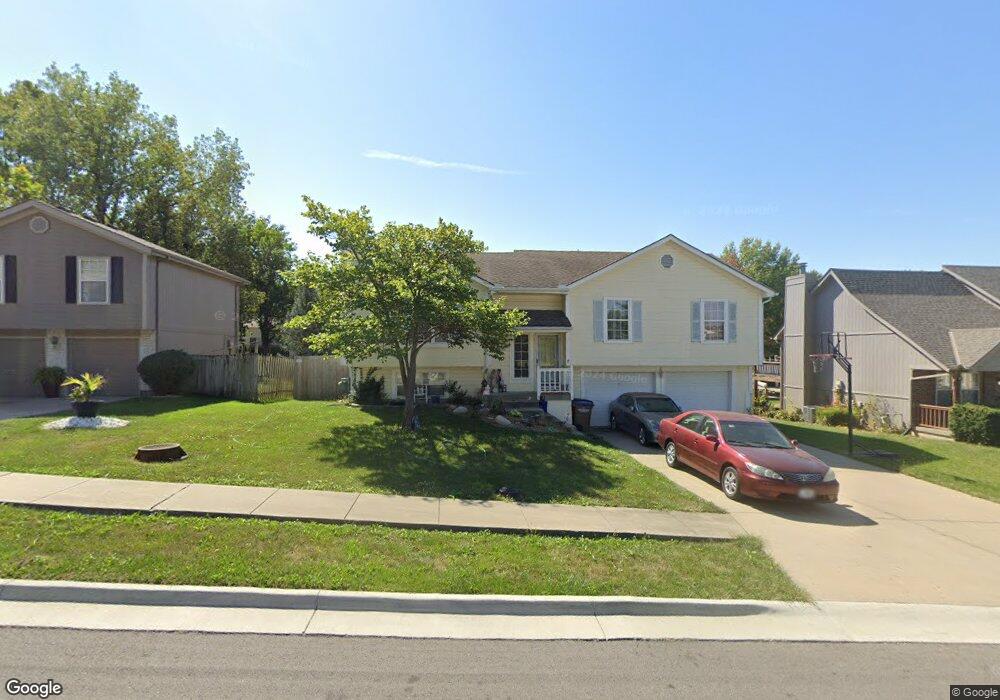
209 W Calico Dr Raymore, MO 64083
Estimated Value: $310,194 - $331,000
3
Beds
3
Baths
1,348
Sq Ft
$236/Sq Ft
Est. Value
About This Home
This home is located at 209 W Calico Dr, Raymore, MO 64083 and is currently estimated at $318,299, approximately $236 per square foot. 209 W Calico Dr is a home located in Cass County with nearby schools including Timber Creek Elementary School, Raymore-Peculiar East Middle School, and Raymore-Peculiar Senior High School.
Ownership History
Date
Name
Owned For
Owner Type
Purchase Details
Closed on
Aug 1, 2022
Sold by
Stanley E Thirsk E and Stanley Audrey L
Bought by
Thirsk Audrey L
Current Estimated Value
Purchase Details
Closed on
Oct 16, 2007
Sold by
Edwards Myron Lionel
Bought by
Edwards Naomi Sharmini
Home Financials for this Owner
Home Financials are based on the most recent Mortgage that was taken out on this home.
Original Mortgage
$153,366
Interest Rate
6.32%
Mortgage Type
FHA
Purchase Details
Closed on
Aug 5, 2005
Sold by
Malone Damon and Malone Marlene
Bought by
Edwards Myron L and Edwards Naomi S
Home Financials for this Owner
Home Financials are based on the most recent Mortgage that was taken out on this home.
Original Mortgage
$152,203
Interest Rate
5.55%
Mortgage Type
VA
Create a Home Valuation Report for This Property
The Home Valuation Report is an in-depth analysis detailing your home's value as well as a comparison with similar homes in the area
Home Values in the Area
Average Home Value in this Area
Purchase History
| Date | Buyer | Sale Price | Title Company |
|---|---|---|---|
| Thirsk Audrey L | -- | None Listed On Document | |
| Edwards Naomi Sharmini | -- | -- | |
| Edwards Myron L | -- | -- |
Source: Public Records
Mortgage History
| Date | Status | Borrower | Loan Amount |
|---|---|---|---|
| Previous Owner | Edwards Naomi Sharmini | $153,366 | |
| Previous Owner | Edwards Myron L | $152,203 |
Source: Public Records
Tax History
| Year | Tax Paid | Tax Assessment Tax Assessment Total Assessment is a certain percentage of the fair market value that is determined by local assessors to be the total taxable value of land and additions on the property. | Land | Improvement |
|---|---|---|---|---|
| 2025 | $2,681 | $36,850 | $4,710 | $32,140 |
| 2024 | $2,681 | $32,950 | $4,280 | $28,670 |
| 2023 | $2,678 | $32,950 | $4,280 | $28,670 |
| 2022 | $2,355 | $28,780 | $4,280 | $24,500 |
| 2021 | $2,355 | $28,780 | $4,280 | $24,500 |
| 2020 | $2,314 | $27,780 | $4,280 | $23,500 |
| 2019 | $2,234 | $27,780 | $4,280 | $23,500 |
| 2018 | $2,075 | $24,920 | $3,610 | $21,310 |
| 2017 | $1,884 | $24,920 | $3,610 | $21,310 |
| 2016 | $1,884 | $23,480 | $3,610 | $19,870 |
| 2015 | $1,885 | $23,480 | $3,610 | $19,870 |
| 2014 | $1,886 | $23,480 | $3,610 | $19,870 |
| 2013 | -- | $23,480 | $3,610 | $19,870 |
Source: Public Records
Map
Nearby Homes
- 205 W Laredo Trail
- 408 N Washington St
- 101 N Franklin St
- 100 N Franklin St
- 317 & 319 W Foxwood Dr
- 0 Madison Creek Dr
- 700 Red Clover Ct
- 703 Wood Sage Ct
- 700 Wood Sage Ct
- 704 Red Clover Ct
- 702 Red Clover Ct
- 702 Wood Sage Ct
- 508 Foxglove Ln
- 608 Wild Lupine Ln
- 612 Wild Lupine Ln
- 704 Wood Sage Ct
- 705 Red Clover Ct
- 701 Wood Sage Ct
- 707 Red Clover Ct
- 706 Blazing Star Dr
- 207 W Calico Dr
- 211 W Calico Dr
- 208 W Heritage Dr
- 205 W Calico Dr
- 213 W Calico Dr
- 210 W Heritage Dr
- 206 W Heritage Dr
- 210 W Calico Dr
- 212 W Calico Dr
- 208 W Calico Dr
- 203 W Calico Dr
- 301 W Calico Dr
- 214 W Calico Dr
- 212 W Heritage Dr
- 204 W Heritage Dr
- 300 W Calico Dr
- 214 W Heritage Dr
- 303 W Calico Dr
- 204 W Calico Dr
- 602 N Jefferson St
Your Personal Tour Guide
Ask me questions while you tour the home.