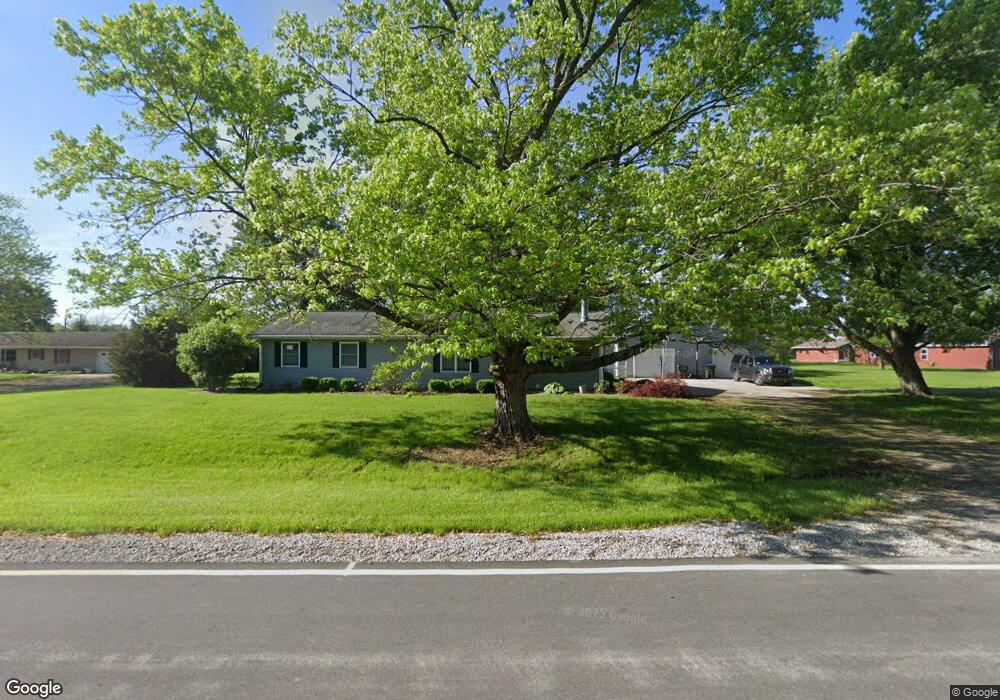
2090 E County Road 250n Mattoon, IL 61938
Estimated Value: $276,000 - $324,000
3
Beds
3
Baths
3,436
Sq Ft
$90/Sq Ft
Est. Value
About This Home
This home is located at 2090 E County Road 250n, Mattoon, IL 61938 and is currently estimated at $308,015, approximately $89 per square foot. 2090 E County Road 250n is a home located in Coles County with nearby schools including Mattoon High School.
Ownership History
Date
Name
Owned For
Owner Type
Purchase Details
Closed on
May 20, 2022
Sold by
Russell Grimm Jr Barry
Bought by
Tipsword Amy Jo and Nastal Janell Rose
Current Estimated Value
Home Financials for this Owner
Home Financials are based on the most recent Mortgage that was taken out on this home.
Original Mortgage
$255,000
Outstanding Balance
$241,423
Interest Rate
4.88%
Mortgage Type
New Conventional
Estimated Equity
$66,592
Purchase Details
Closed on
May 3, 2021
Sold by
Okley Terri and Grim Terria
Bought by
Grimm Barry Russell
Home Financials for this Owner
Home Financials are based on the most recent Mortgage that was taken out on this home.
Original Mortgage
$280,000
Interest Rate
3.1%
Mortgage Type
VA
Purchase Details
Closed on
Sep 22, 2006
Sold by
Probst Rose Marie
Bought by
Grim Terri A
Home Financials for this Owner
Home Financials are based on the most recent Mortgage that was taken out on this home.
Original Mortgage
$100,000
Interest Rate
6.49%
Mortgage Type
New Conventional
Create a Home Valuation Report for This Property
The Home Valuation Report is an in-depth analysis detailing your home's value as well as a comparison with similar homes in the area
Purchase History
| Date | Buyer | Sale Price | Title Company |
|---|---|---|---|
| Tipsword Amy Jo | $275,000 | None Listed On Document | |
| Grimm Barry Russell | $280,000 | Attorney | |
| Grim Terri A | $123,500 | None Available |
Source: Public Records
Mortgage History
| Date | Status | Borrower | Loan Amount |
|---|---|---|---|
| Open | Tipsword Amy Jo | $255,000 | |
| Previous Owner | Grimm Barry Russell | $280,000 | |
| Previous Owner | Grim Terri A | $100,000 |
Source: Public Records
Tax History
| Year | Tax Paid | Tax Assessment Tax Assessment Total Assessment is a certain percentage of the fair market value that is determined by local assessors to be the total taxable value of land and additions on the property. | Land | Improvement |
|---|---|---|---|---|
| 2024 | $6,442 | $107,576 | $5,497 | $102,079 |
| 2023 | $6,337 | $97,796 | $4,997 | $92,799 |
| 2022 | $6,337 | $96,180 | $4,914 | $91,266 |
| 2021 | $3,960 | $59,989 | $4,496 | $55,493 |
| 2020 | $2,350 | $39,636 | $4,658 | $34,978 |
| 2019 | $2,294 | $38,255 | $4,496 | $33,759 |
| 2018 | $2,259 | $38,255 | $4,496 | $33,759 |
| 2017 | $2,278 | $38,255 | $4,496 | $33,759 |
| 2016 | $2,249 | $38,255 | $4,496 | $33,759 |
| 2015 | $1,545 | $37,505 | $4,408 | $33,097 |
| 2014 | $1,545 | $37,505 | $4,408 | $33,097 |
| 2013 | $1,545 | $37,505 | $4,408 | $33,097 |
Source: Public Records
Map
Nearby Homes
- 2029 E Co Road 250 N
- 3028 N County Road 150e
- 3221 E Lake Paradise Rd
- 9 Joan Marie Dr
- 67 Lakeview Rd
- 83 Lakeview Rd
- 27 Lakeview Rd
- 87 & 89 Clear Creek Dr
- 83 Clear Creek Dr
- 2 Clear Creek Dr
- 4211 & 4213 Lake Land Blvd
- 10 Clear Creek Dr
- 22 Lakeview Dr
- 55 Shorts Dr
- 916 S 36th St
- 308 Melody Ln
- 3905 Western Ave
- 1 Western Avenue Heights
- 1104 Annis Ave
- 1416 S Lawn Dr
- 2090 E County Road 250n
- 2090 E County Road 250n
- 2105E E County Road 250n
- 2160 E County Road 250n
- 2126E E County Road 250n
- 2105 E Co Road 250 N
- 2012 E County Road 250n
- 2121E E County Road 250n
- 2152 E County Road 250n
- 2143 E Co Road 250 N
- 2000 E County Road 250n
- 2143 E County Road 250n
- 2007E E County Road 240n
- 2007 E County Road 240n
- 1999 E County Road 250n
- 2169 E County Road 250n
- 2028E E County Road 250n
- 2169 E County Road 250n
- 2028 E County Road 250n
- 2169 E Co Road 250 N
Your Personal Tour Guide
Ask me questions while you tour the home.