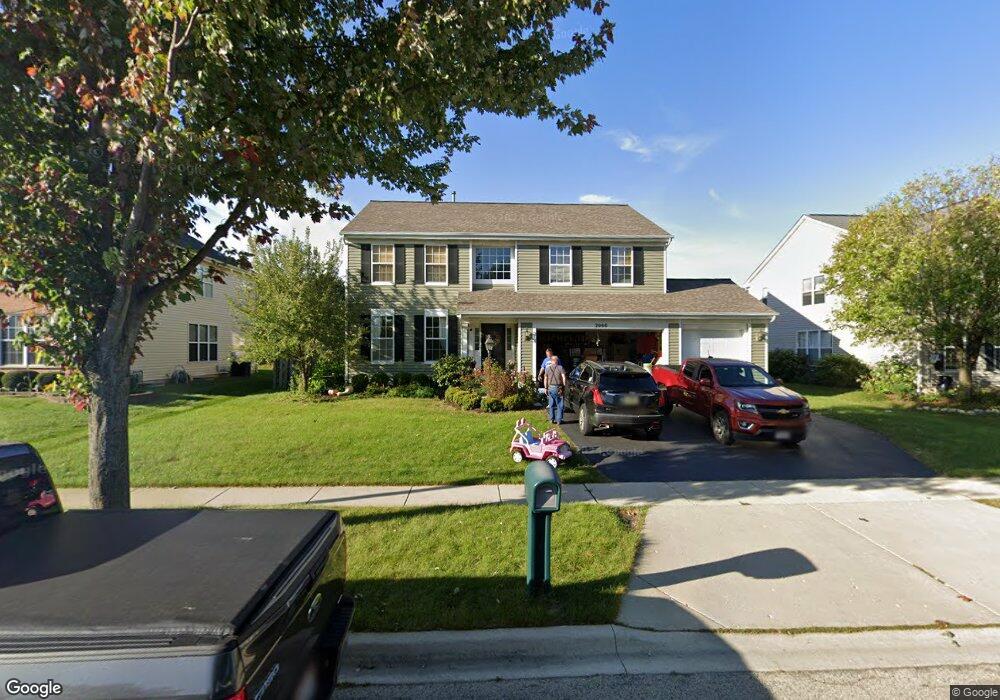
2090 Tracy Ln Algonquin, IL 60102
Estimated Value: $493,000 - $535,000
4
Beds
3
Baths
2,652
Sq Ft
$193/Sq Ft
Est. Value
About This Home
This home is located at 2090 Tracy Ln, Algonquin, IL 60102 and is currently estimated at $510,756, approximately $192 per square foot. 2090 Tracy Ln is a home located in Kane County with nearby schools including Westfield Community School and Harry D Jacobs High School.
Ownership History
Date
Name
Owned For
Owner Type
Purchase Details
Closed on
Jan 7, 2009
Sold by
Hsbc Bank Usa National Association
Bought by
Didricksen Jeffrey J and Ondrus Geneen
Current Estimated Value
Home Financials for this Owner
Home Financials are based on the most recent Mortgage that was taken out on this home.
Original Mortgage
$226,902
Outstanding Balance
$142,499
Interest Rate
5.06%
Mortgage Type
FHA
Estimated Equity
$368,257
Purchase Details
Closed on
Apr 25, 2008
Sold by
Spagnola David V
Bought by
Hsbc Bank Usa Na and Wells Fargo Home Equity Trust 2004-2
Purchase Details
Closed on
Aug 15, 2000
Sold by
Willoughby Farms Ltd Partnership
Bought by
Spagnola David and Spagnola Jacqueline M
Home Financials for this Owner
Home Financials are based on the most recent Mortgage that was taken out on this home.
Original Mortgage
$200,000
Interest Rate
8.15%
Create a Home Valuation Report for This Property
The Home Valuation Report is an in-depth analysis detailing your home's value as well as a comparison with similar homes in the area
Home Values in the Area
Average Home Value in this Area
Purchase History
| Date | Buyer | Sale Price | Title Company |
|---|---|---|---|
| Didricksen Jeffrey J | $253,000 | Attorneys Title Guaranty Fun | |
| Hsbc Bank Usa Na | -- | None Available | |
| Spagnola David | $257,000 | -- |
Source: Public Records
Mortgage History
| Date | Status | Borrower | Loan Amount |
|---|---|---|---|
| Open | Didricksen Jeffrey J | $226,902 | |
| Previous Owner | Spagnola David | $200,000 |
Source: Public Records
Tax History Compared to Growth
Tax History
| Year | Tax Paid | Tax Assessment Tax Assessment Total Assessment is a certain percentage of the fair market value that is determined by local assessors to be the total taxable value of land and additions on the property. | Land | Improvement |
|---|---|---|---|---|
| 2024 | $9,694 | $136,003 | $23,443 | $112,560 |
| 2023 | $9,203 | $122,371 | $21,093 | $101,278 |
| 2022 | $8,650 | $111,008 | $21,093 | $89,915 |
| 2021 | $8,387 | $104,814 | $19,916 | $84,898 |
| 2020 | $8,217 | $102,457 | $19,468 | $82,989 |
| 2019 | $7,962 | $97,263 | $18,481 | $78,782 |
| 2018 | $8,015 | $95,337 | $18,115 | $77,222 |
| 2017 | $7,678 | $89,184 | $16,946 | $72,238 |
| 2016 | $7,464 | $82,248 | $16,408 | $65,840 |
| 2015 | -- | $76,818 | $17,040 | $59,778 |
| 2014 | -- | $71,902 | $16,569 | $55,333 |
| 2013 | -- | $74,103 | $17,076 | $57,027 |
Source: Public Records
Map
Nearby Homes
- 1261 Glenmont St
- 1051 Waterford St
- 1101 Waterford St
- 1081 Waterford St
- 1263 Glenmont St
- 1269 Glenmont St
- 1110 Waterford St
- 130 Newburgh Ln
- 1161 Waterford St
- 2070 Cosman Way
- 2040 Cosman Way
- 2262 Stonegate Rd
- 1260 Glenmont St
- 1121 Waterford St
- 1071 Waterford St
- 2258 Stonegate Rd
- 1061 Waterford St
- 2030 Cosman Way
- 1171 Waterford St
- 2256 Stonegate Rd
- 2100 Tracy Ln
- 2080 Tracy Ln
- 2110 Tracy Ln
- 2070 Tracy Ln
- 2081 Tracy Ln
- 2120 Tracy Ln
- 2300 Poets Ln
- 2071 Tracy Ln
- 2 Joyce Ct Unit 3
- 2130 Tracy Ln
- 2305 Poets Ln
- 4 Joyce Ct
- 2304 Poets Ln Unit 3
- 2111 Tracy Ln Unit 4
- 2300 Tracy Ln
- 2121 Tracy Ln
- 2309 Poets Ln Unit 3
- 2304 Tracy Ln
- 2308 Poets Ln
- 2131 Tracy Ln