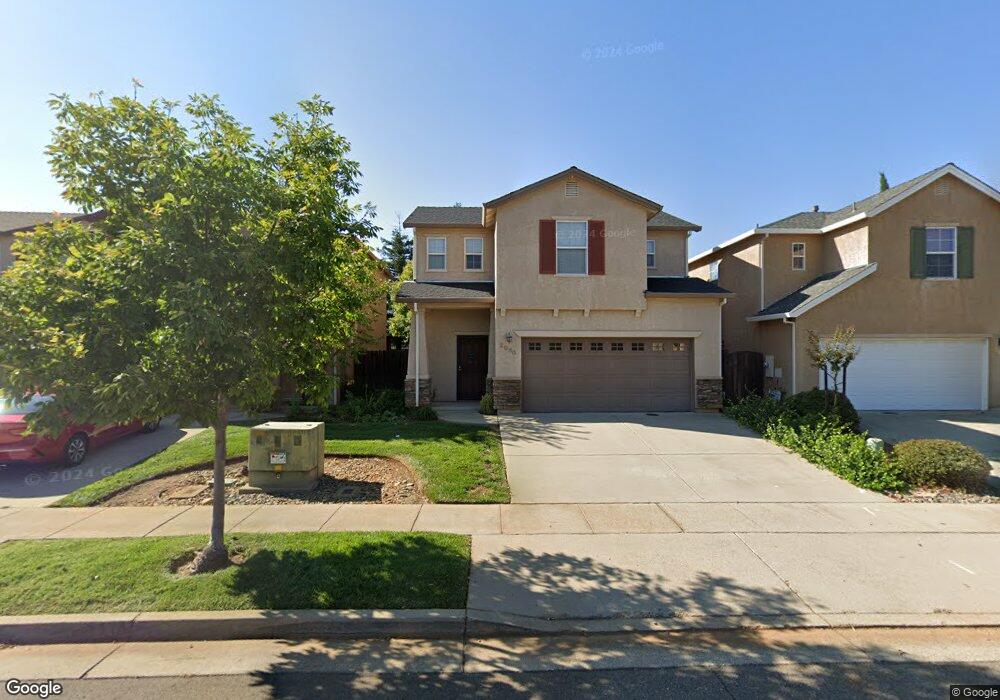
2090 Tuscany Way Unit Lot 8 Redding, CA 96003
North Shasta View NeighborhoodEstimated Value: $339,777 - $354,000
3
Beds
3
Baths
1,485
Sq Ft
$235/Sq Ft
Est. Value
About This Home
This home is located at 2090 Tuscany Way Unit Lot 8, Redding, CA 96003 and is currently estimated at $349,444, approximately $235 per square foot. 2090 Tuscany Way Unit Lot 8 is a home located in Shasta County with nearby schools including Shasta Meadows Elementary School, Parsons Junior High School, and Enterprise High School.
Ownership History
Date
Name
Owned For
Owner Type
Purchase Details
Closed on
Apr 8, 2019
Sold by
Zimmerman Robert L and Zimmerman Betsy M
Bought by
Rhyne Rachel Marie and Bayley Daniel Gregory
Current Estimated Value
Home Financials for this Owner
Home Financials are based on the most recent Mortgage that was taken out on this home.
Original Mortgage
$183,750
Outstanding Balance
$161,549
Interest Rate
4.3%
Mortgage Type
New Conventional
Estimated Equity
$187,895
Purchase Details
Closed on
Aug 25, 2008
Sold by
S&J Development Inc
Bought by
Zimmerman Robert L and Zimmerman Betsey M
Home Financials for this Owner
Home Financials are based on the most recent Mortgage that was taken out on this home.
Original Mortgage
$126,250
Interest Rate
5.77%
Mortgage Type
Purchase Money Mortgage
Create a Home Valuation Report for This Property
The Home Valuation Report is an in-depth analysis detailing your home's value as well as a comparison with similar homes in the area
Home Values in the Area
Average Home Value in this Area
Purchase History
| Date | Buyer | Sale Price | Title Company |
|---|---|---|---|
| Rhyne Rachel Marie | $245,000 | Placer Title Company | |
| Zimmerman Robert L | $252,500 | Placer Title Company |
Source: Public Records
Mortgage History
| Date | Status | Borrower | Loan Amount |
|---|---|---|---|
| Open | Rhyne Rachel Marie | $183,750 | |
| Previous Owner | Zimmerman Robert L | $126,250 |
Source: Public Records
Tax History Compared to Growth
Tax History
| Year | Tax Paid | Tax Assessment Tax Assessment Total Assessment is a certain percentage of the fair market value that is determined by local assessors to be the total taxable value of land and additions on the property. | Land | Improvement |
|---|---|---|---|---|
| 2025 | $3,034 | $273,297 | $61,351 | $211,946 |
| 2024 | $2,991 | $267,940 | $60,149 | $207,791 |
| 2023 | $2,991 | $262,687 | $58,970 | $203,717 |
| 2022 | $2,906 | $257,537 | $57,814 | $199,723 |
| 2021 | $2,803 | $252,488 | $56,681 | $195,807 |
| 2020 | $2,775 | $249,900 | $56,100 | $193,800 |
| 2019 | $2,761 | $245,000 | $55,000 | $190,000 |
| 2018 | $2,780 | $244,800 | $56,100 | $188,700 |
| 2017 | $2,806 | $240,000 | $55,000 | $185,000 |
| 2016 | $2,492 | $220,000 | $55,000 | $165,000 |
| 2015 | $2,222 | $196,000 | $55,000 | $141,000 |
| 2014 | $2,074 | $181,000 | $50,000 | $131,000 |
Source: Public Records
Map
Nearby Homes
- 2030 Hedgerow Ave
- 2293 Milano Trail
- 1945 Salzburg Trail
- Stacey Plan at Sonata
- Caroline Plan at Sonata
- Rosie Plan at Sonata
- Leah Plan at Sonata
- 2531 Rainbow Ln
- 2517 Atrium Way
- 2238 Sophy Place
- 1802 Whaley Ct
- 2795 Carolee Ct
- 1703 Cascade Ln
- 1610 Oakdale Ct
- 2164 Oxford Rd
- 1939 Cameo Ct
- 1565 Becky Way
- 1401 Casa Vereda Way
- 1511 Oakdale Ln
- 2399 Jonquil Way
- 2090 Tuscany Way
- 2078 Tuscany Way Unit Lot 7
- 2078 Tuscany Way
- 2104 Tuscany Way Unit Lot 9
- 2104 Tuscany Way
- The Tuscany Way
- 000 Tuscany Way
- 00 Tuscany Way
- 2066 Tuscany Way Unit Lot 6
- 2066 Tuscany Way
- 2114 Tuscany Way Unit Lot 10
- 2114 Tuscany Way
- 2124 Tuscany Way Unit Lot 11
- 2124 Tuscany Way
- 2054 Tuscany Way
- 2042 Tuscany Way
- 2142 Tuscany Way
- 2304 La Villa Way Unit Lot 150
- 2304 La Villa Way
- 2103 Tuscany Way Unit Lot 38