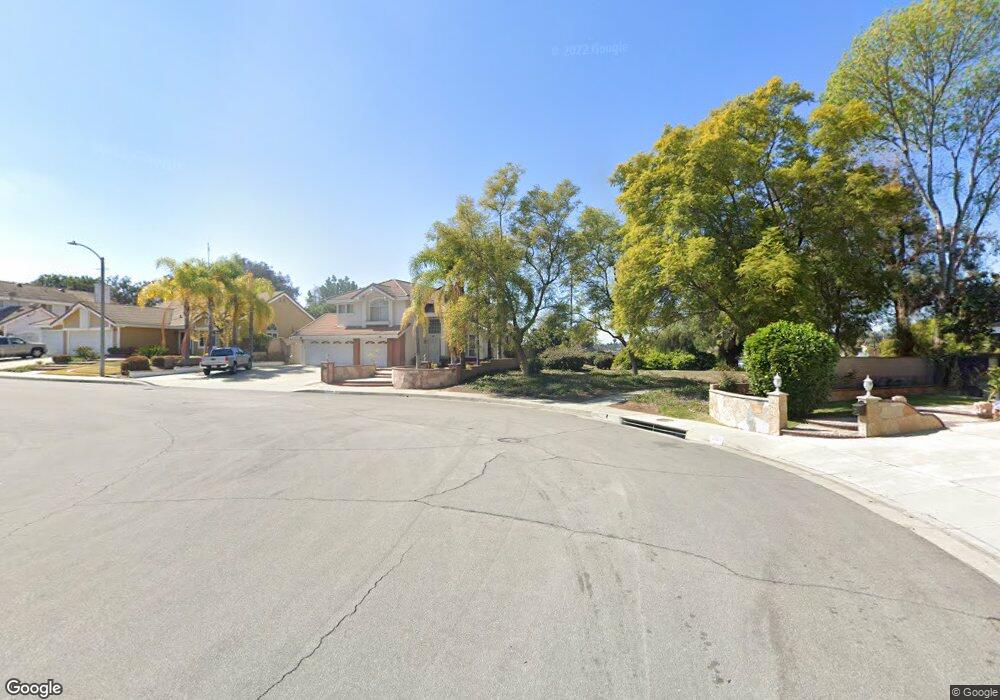
20904 Brookline Dr Walnut, CA 91789
Estimated Value: $1,254,602 - $1,477,000
5
Beds
3
Baths
2,197
Sq Ft
$635/Sq Ft
Est. Value
About This Home
This home is located at 20904 Brookline Dr, Walnut, CA 91789 and is currently estimated at $1,394,651, approximately $634 per square foot. 20904 Brookline Dr is a home located in Los Angeles County with nearby schools including Vejar Elementary School, Suzanne Middle School, and Walnut High School.
Ownership History
Date
Name
Owned For
Owner Type
Purchase Details
Closed on
Mar 31, 2009
Sold by
Cheng James Tee and Cheng Savay Viengkhou
Bought by
Cheng James Tee and Cheng Savay Viengkhou
Current Estimated Value
Purchase Details
Closed on
May 14, 2004
Sold by
Cheng Savay V
Bought by
Cheng Jiann L and Cheng Savay V
Purchase Details
Closed on
May 28, 1999
Sold by
Cheng Savay V
Bought by
Cheng Savay V and Cheng Jiann Loong
Purchase Details
Closed on
Feb 2, 1999
Sold by
Meza Joe H and Meza Janeth
Bought by
Cheng Savay V
Home Financials for this Owner
Home Financials are based on the most recent Mortgage that was taken out on this home.
Original Mortgage
$247,500
Outstanding Balance
$57,979
Interest Rate
6.62%
Estimated Equity
$1,336,672
Purchase Details
Closed on
Oct 8, 1993
Sold by
Ahmed Patricia G
Bought by
Meza Joe Henry and Meza Janeth
Home Financials for this Owner
Home Financials are based on the most recent Mortgage that was taken out on this home.
Original Mortgage
$254,000
Interest Rate
4.62%
Create a Home Valuation Report for This Property
The Home Valuation Report is an in-depth analysis detailing your home's value as well as a comparison with similar homes in the area
Home Values in the Area
Average Home Value in this Area
Purchase History
| Date | Buyer | Sale Price | Title Company |
|---|---|---|---|
| Cheng James Tee | -- | None Available | |
| Cheng Jiann L | -- | -- | |
| Cheng Savay V | -- | -- | |
| Cheng Savay V | $330,000 | Chicago Title Co | |
| Cheng Savay V | -- | Chicago Title Co | |
| Meza Joe Henry | -- | Continental Lawyers Title Co |
Source: Public Records
Mortgage History
| Date | Status | Borrower | Loan Amount |
|---|---|---|---|
| Open | Cheng Savay V | $247,500 | |
| Previous Owner | Meza Joe Henry | $254,000 |
Source: Public Records
Tax History
| Year | Tax Paid | Tax Assessment Tax Assessment Total Assessment is a certain percentage of the fair market value that is determined by local assessors to be the total taxable value of land and additions on the property. | Land | Improvement |
|---|---|---|---|---|
| 2025 | $6,961 | $517,326 | $188,115 | $329,211 |
| 2024 | $6,961 | $507,183 | $184,427 | $322,756 |
| 2023 | $6,806 | $497,239 | $180,811 | $316,428 |
| 2022 | $6,675 | $487,490 | $177,266 | $310,224 |
| 2021 | $6,554 | $477,933 | $173,791 | $304,142 |
| 2019 | $6,364 | $463,759 | $168,637 | $295,122 |
| 2018 | $6,080 | $454,667 | $165,331 | $289,336 |
| 2016 | $5,661 | $437,013 | $158,912 | $278,101 |
| 2015 | $5,676 | $430,449 | $156,525 | $273,924 |
| 2014 | $5,702 | $422,018 | $153,459 | $268,559 |
Source: Public Records
Map
Nearby Homes
- 21002 Cornerstone Dr
- 0 Gartel Dr
- 21529 Magnolia St
- 351 Spur Trail Ave
- 20824 Fuero Dr
- 21530 Magnolia St
- 330 Amberwood Dr
- 602 Lone Eagle Rd
- 20487 Gartel Dr
- 931 Sky Meadow Place
- 805 Silver Valley Trail
- 792 El Vallencito Dr
- 540 Citadel Dr
- 1025 N Horseshoe Bend
- 22046 Florence Cir
- 180 Ricci Ave
- 221 Roma Ct
- 970 Estate Ct
- 226 Roma Ct
- 22060 Florence Cir
- 20910 Brookline Dr
- 20916 Brookline Dr
- 20906 Northview Dr
- 20901 Northview Dr
- 20905 Northview Dr
- 20912 Northview Dr
- 20922 Brookline Dr
- 20911 Northview Dr
- 20918 Northview Dr
- 20939 Brookline Dr
- 20926 Brookline Dr
- 20919 Northview Dr
- 20934 Brookline Dr
- 20926 Northview Dr
- 20927 Northview Dr
- 568 Tri Net Ct
- 356 Deerfield Dr
- 558 Tri Net Ct Unit 1
- 558 Tri Net Ct
- 20949 Brookline Dr
Your Personal Tour Guide
Ask me questions while you tour the home.