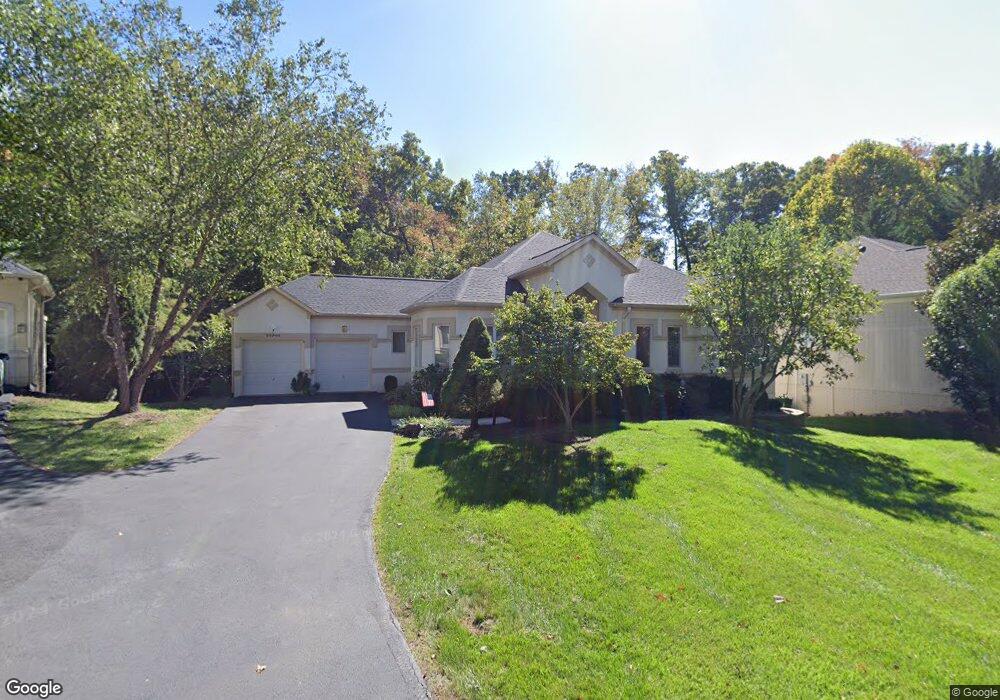
20904 Waterbeach Place Sterling, VA 20165
Estimated Value: $956,000 - $1,069,000
3
Beds
4
Baths
3,758
Sq Ft
$268/Sq Ft
Est. Value
About This Home
This home is located at 20904 Waterbeach Place, Sterling, VA 20165 and is currently estimated at $1,007,753, approximately $268 per square foot. 20904 Waterbeach Place is a home located in Loudoun County with nearby schools including Lowes Island Elementary School, Seneca Ridge Middle School, and Dominion High School.
Ownership History
Date
Name
Owned For
Owner Type
Purchase Details
Closed on
Oct 7, 2021
Sold by
Taylor Eve and Allen John Taylor Revocable Tr
Bought by
Taylor Eve
Current Estimated Value
Purchase Details
Closed on
Apr 18, 2011
Sold by
Wood Jerry J
Bought by
Taylor Tr Allen J and Allen J Taylor Revoc Trust
Purchase Details
Closed on
May 30, 2002
Sold by
Horn Hasty M
Bought by
Wood Jerry J
Home Financials for this Owner
Home Financials are based on the most recent Mortgage that was taken out on this home.
Original Mortgage
$225,000
Interest Rate
7%
Mortgage Type
New Conventional
Purchase Details
Closed on
Jul 22, 1997
Sold by
Jaguar Homes Lc
Bought by
Horn Hasty M and Horn Laura A
Home Financials for this Owner
Home Financials are based on the most recent Mortgage that was taken out on this home.
Original Mortgage
$235,000
Interest Rate
7.79%
Mortgage Type
New Conventional
Create a Home Valuation Report for This Property
The Home Valuation Report is an in-depth analysis detailing your home's value as well as a comparison with similar homes in the area
Home Values in the Area
Average Home Value in this Area
Purchase History
| Date | Buyer | Sale Price | Title Company |
|---|---|---|---|
| Taylor Eve | -- | None Available | |
| Taylor Tr Allen J | $616,000 | -- | |
| Wood Jerry J | $535,000 | -- | |
| Horn Hasty M | $383,460 | -- |
Source: Public Records
Mortgage History
| Date | Status | Borrower | Loan Amount |
|---|---|---|---|
| Previous Owner | Wood Jerry J | $225,000 | |
| Previous Owner | Horn Hasty M | $235,000 |
Source: Public Records
Tax History Compared to Growth
Tax History
| Year | Tax Paid | Tax Assessment Tax Assessment Total Assessment is a certain percentage of the fair market value that is determined by local assessors to be the total taxable value of land and additions on the property. | Land | Improvement |
|---|---|---|---|---|
| 2025 | $6,833 | $848,860 | $255,700 | $593,160 |
| 2024 | $7,188 | $830,950 | $250,700 | $580,250 |
| 2023 | $6,558 | $749,460 | $245,700 | $503,760 |
| 2022 | $6,786 | $762,480 | $240,700 | $521,780 |
| 2021 | $6,846 | $698,560 | $222,100 | $476,460 |
| 2020 | $6,478 | $625,870 | $212,100 | $413,770 |
| 2019 | $6,131 | $586,680 | $212,100 | $374,580 |
| 2018 | $6,174 | $568,990 | $212,100 | $356,890 |
| 2017 | $6,312 | $561,070 | $212,100 | $348,970 |
| 2016 | $6,966 | $608,390 | $0 | $0 |
| 2015 | $6,761 | $383,590 | $0 | $383,590 |
| 2014 | $6,831 | $379,340 | $0 | $379,340 |
Source: Public Records
Map
Nearby Homes
- 20765 Bank Way
- 47692 Sandbank Square
- 47616 Watkins Island Square
- 47630 Sandbank Square
- 47593 Sandbank Square
- 47558 Tenfoot Island Terrace
- 47587 Comer Square
- 20898 Prince Lowes Terrace
- 20810 Noble Terrace Unit 205
- 10217 Mckean Ct
- 20745 Royal Palace Square Unit 207
- 423 Seneca Rd
- 20548 Tidewater Ct
- 20900 Butterwood Falls Terrace
- 47379 Darkhollow Falls Terrace
- 308 Sinegar Place
- 47788 Saulty Dr
- 615 Kentland Dr
- 20366 Clover Field Terrace
- 606 Kentland Dr
- 20908 Waterbeach Place
- 20900 Waterbeach Place
- 20896 Waterbeach Place
- 20912 Waterbeach Place
- 20888 Waterbeach Place
- 20884 Waterbeach Place
- 20892 Waterbeach Place
- 20913 Waterbeach Place
- 20905 Waterbeach Place
- 20901 Waterbeach Place
- 20909 Waterbeach Place
- 20876 Waterbeach Place
- 20880 Waterbeach Place
- 20853 Waterbeach Place
- 20872 Waterbeach Place
- 20868 Channel Ct
- 20864 Channel Ct
- 47673 Pennrun Way
- 20849 Waterbeach Place
- 20852 Channel Ct